readldt
The readldt function imports the luminous intensity distribution curve from .ldt EULUMDAT files.
Note 1: EULUMDAT files are usually normalized at 1000 lm luminaire luminous flux, the luminous intensity are therefore given in cd/klm. For example, the luminous Intensity distribution curve (LDC) of a luminaire with 4000 lm needs to be adapted by the factor 4.
Note 2: The function does currently cannot handle symmetry type 3.
Usage:
ldt = readldt(file)
Where:
| Parameter | Description |
ldt | Is the return struct containing the EULUMDAT file information: ldt.header – contains the file header information ldt.anglesC – contains the C angles ldt.anglesG – contains the \gamma angles ldt.I – contains the corresponding luminous intensities |
file | specifies the path and filename |
Examples
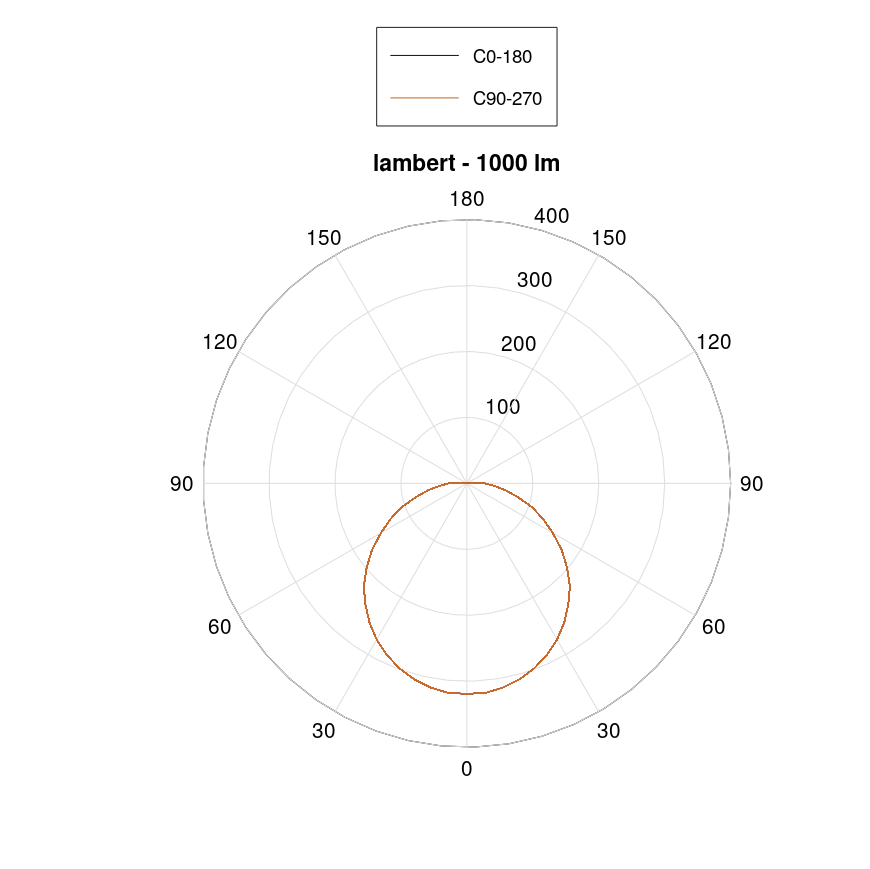
Open and plot lambert.ldt file:
ldc = readldt('lambert.ldt');
plot2dldc(ldc)
See also: plot2dldc
Result:
Note: to select a *.ldt file via popup menu, use the following code snippet:
[file,path] = uigetfile('*.ldt');
% select lamber.ldt EULUMDAT file %
ldt = readldt([path file])
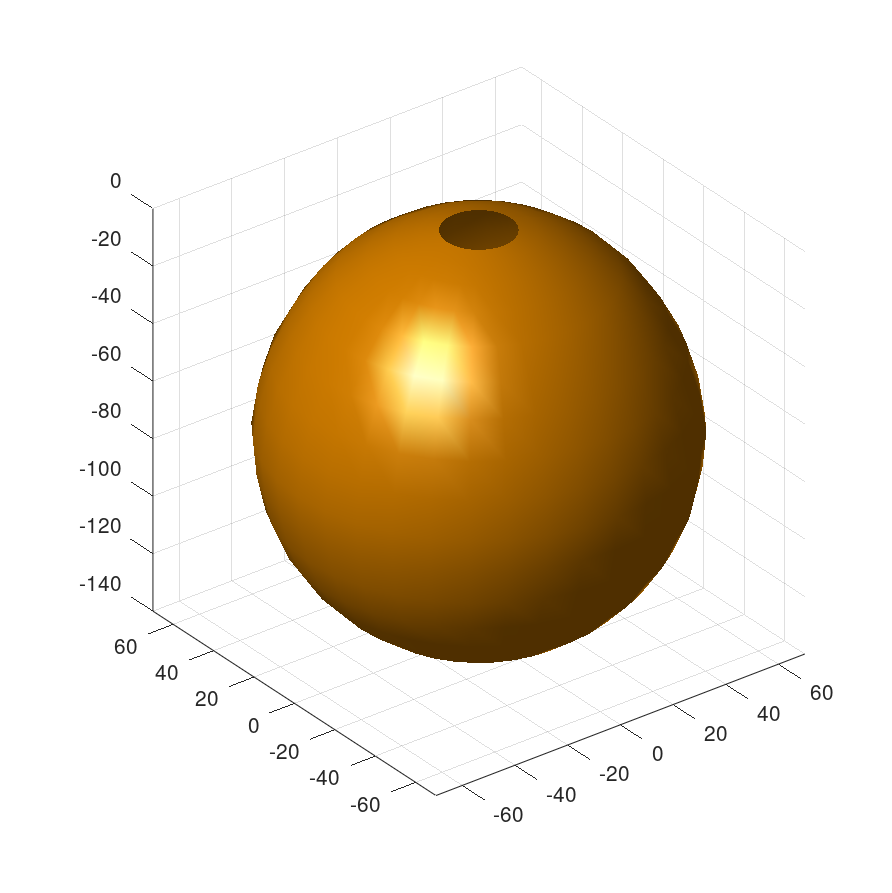
Open lambert.ldt using a popup dialog window and plot in 3D:
ldt = readldt('lambert.ldt')
plot3dldc(ldt)
See also: plot3dldc