The ciespec2wp function determines the white point of an illuminant’s spectral power distribution. Any errors in the data set or in results generated with the Lighting Toolbox are not in the liability of the CIE nor me, see licence.
See also: ciewhitepoint
Usage:
[XYZ,xyz] = ciespec2wp(lam,spec,observer)
Where:
| Parameter | Description |
XYZ | Are the retuned tristimulus values of the standard illuminant, scaled so that Y = 1. |
xyz | Are the returned normalized tristimulus values, scaled so that x+y+z = 1. |
lam | Defines the wavelengths, vector |
spec | Defines the spectral power distribution(s), vector or matrix |
observer | Specifies the standard observer: ‘xyz’ = standard 2° observer (default) ‘xyz10’ = standard 10° observer |
Examples
Whitepoint of CIE standard illuminant ‘A’, ‘E’ and ‘D65’:
lam = 360:830;
spec = ciespec(lam,{'A','E','D65'});
[XYZ,xyz] = ciespec2wp(lam,spec)
See also: ciewhitepoint, ciespec
Result:
XYZ =

   1.0984   1.0000   0.3559
   1.0001   1.0000   1.0003
   0.9505   1.0000   1.0888

xyz =

   0.4475   0.4074   0.1450
   0.3333   0.3333   0.3334
   0.3127   0.3290   0.3582
Whitepoint of CIE standard illuminant ‘A’ for 10° standard observer:
lam = 360:830;
spec = ciespec(lam,'A');
[XYZ,xyz] = ciespec2wp(lam,spec,'xyz10')
See also: ciewhitepoint, ciespec
Result:
XYZ =

   1.1114   1.0000   0.3521

xyz =

   0.4511   0.4059   0.1429
Determine the tristimulus values X,Y,Z for standard illuminant ‘D65’ with an resulting photometric value of Y = 15000:
lam = 360:830;
spec = ciespec(lam,'D65');
XYZ = ciespec2wp(lam,spec).*15000
See also: ciewhitepoint, ciespec
Result:
XYZ =

   1.4257e+04   1.5000e+04   1.6332e+04
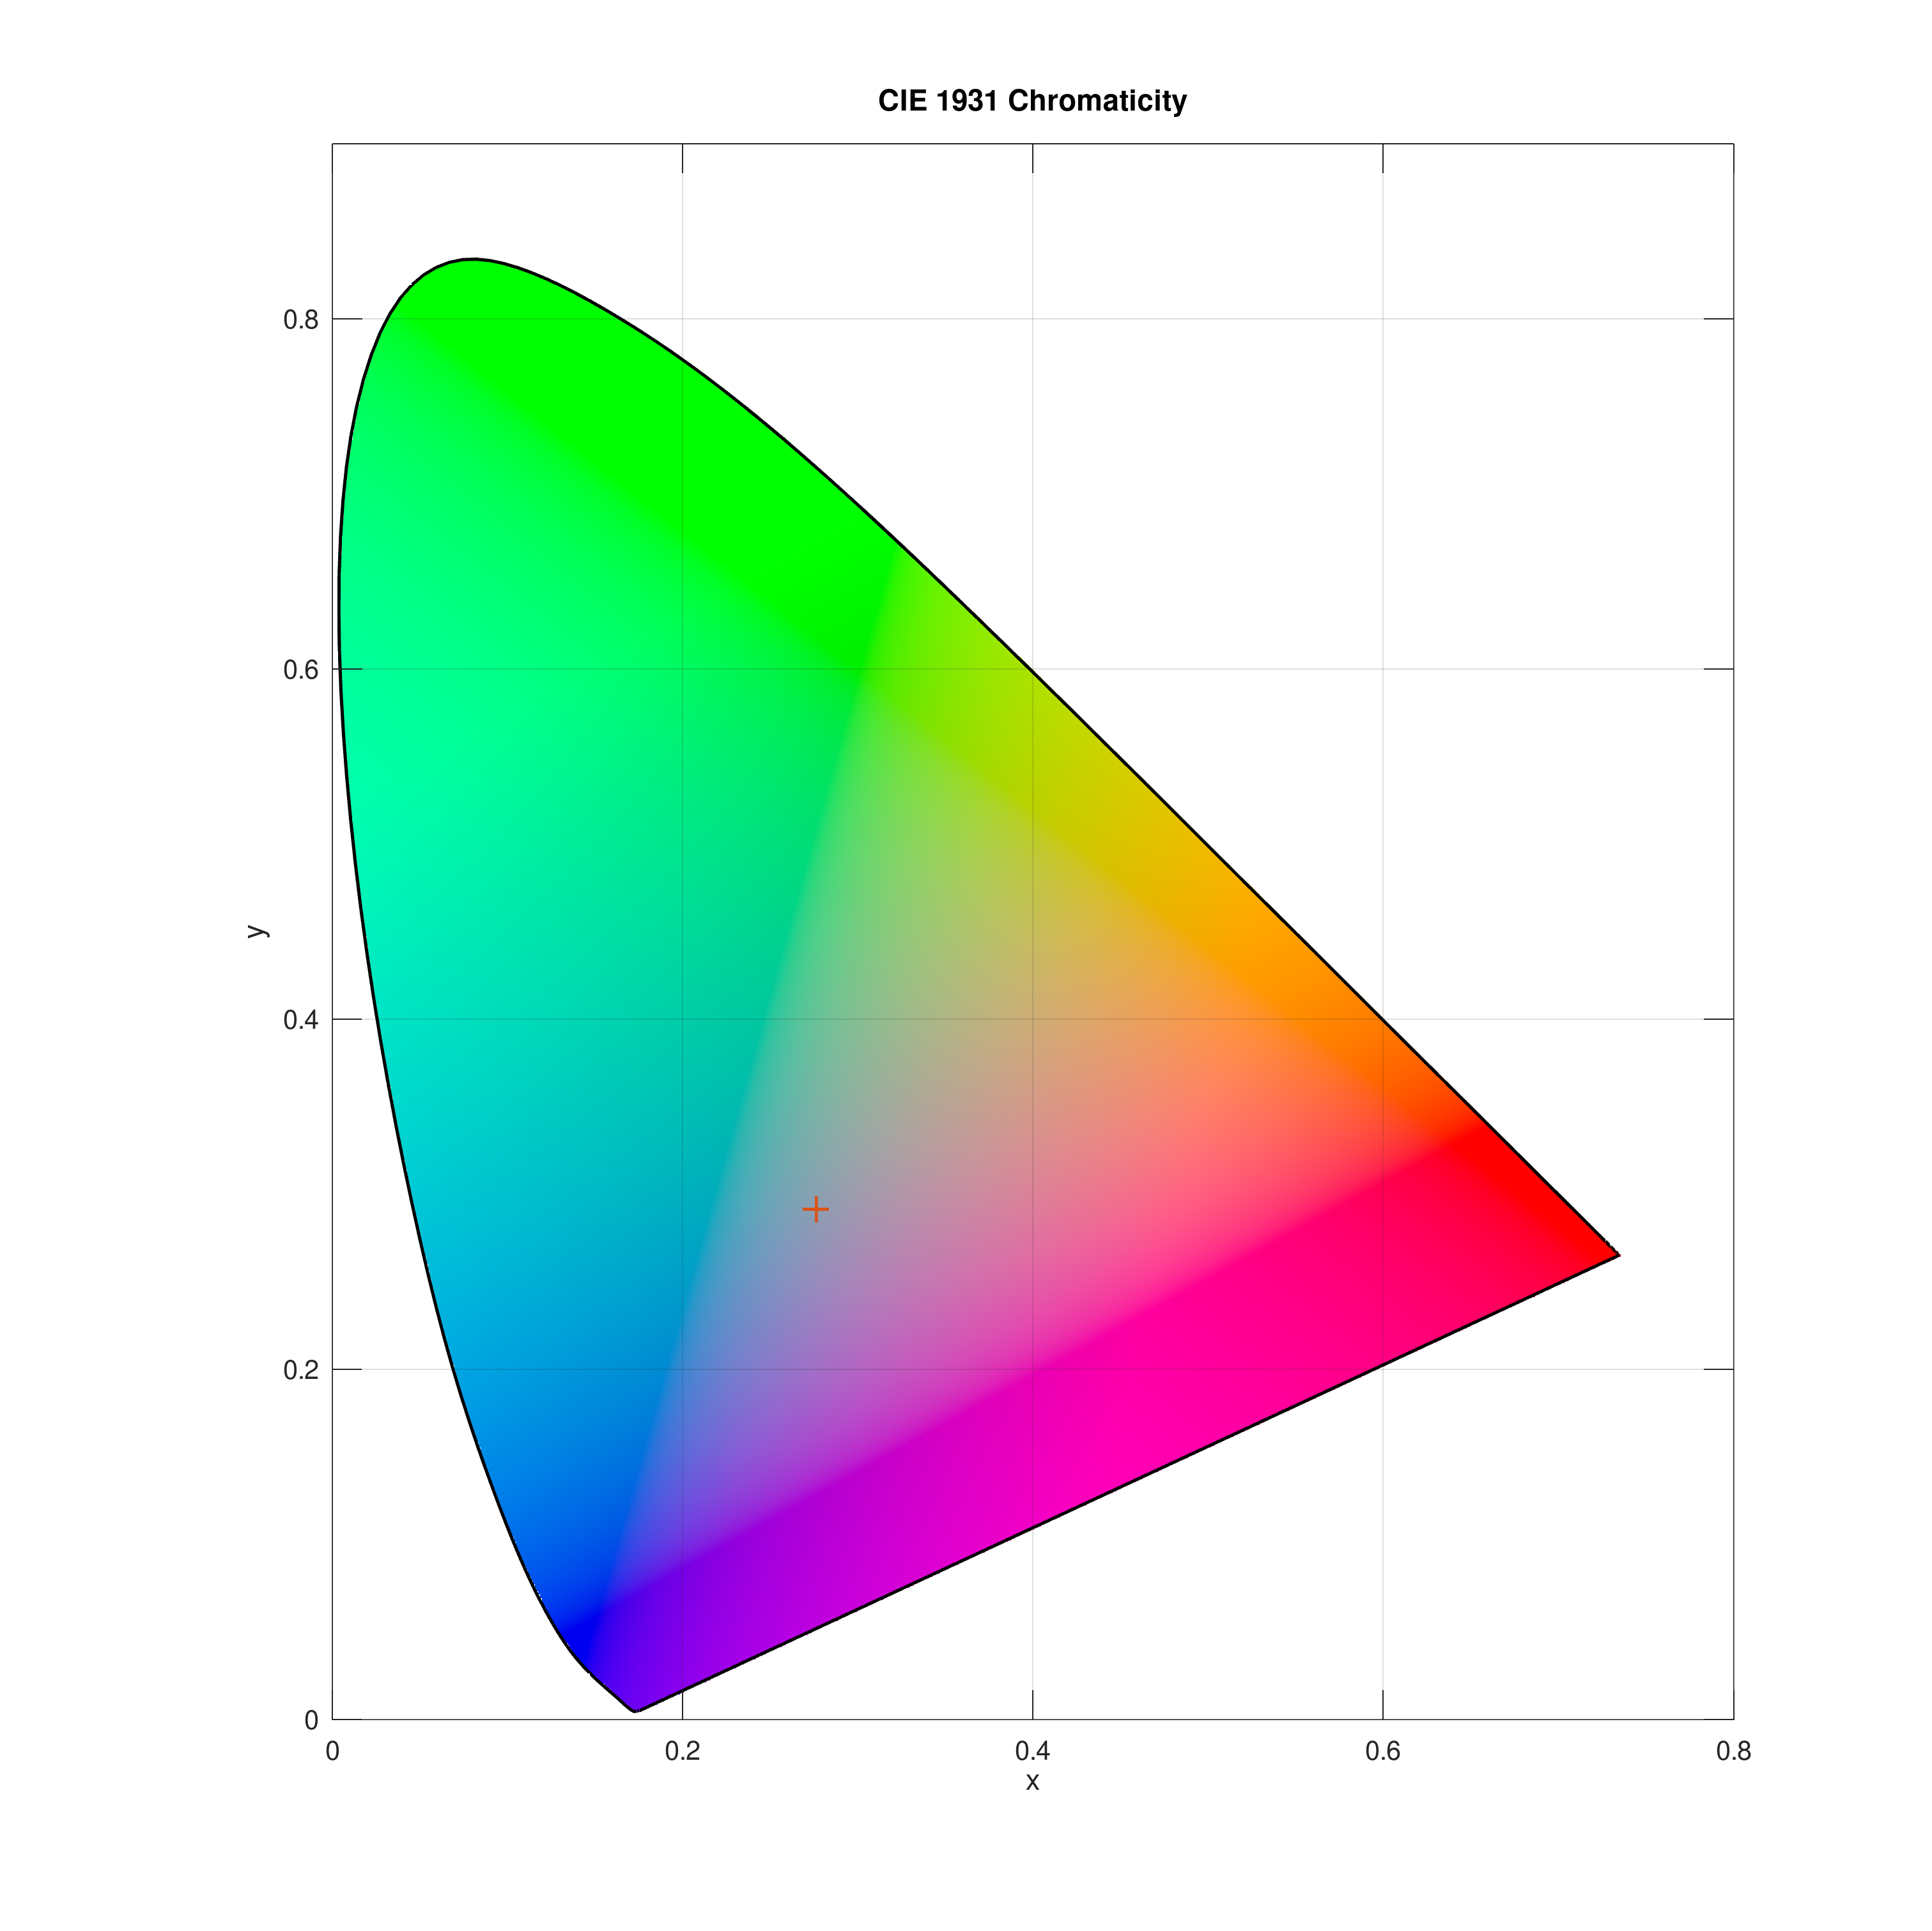
Determine and plot the whitepoint of an artificial spectral power distribution (SPD):
lam = 380:780;
% create a linear decreasing SPD
spec = linspace(1,0,numel(lam));
[~,xyz] = ciespec2wp(lam,spec)
plotciexy(xyz(1),xyz(2))
See also: plotciexy
Result:
xyz =

   0.2762   0.2916   0.4322

References: