The bayerpattern function creates a bayerpattern plot.
Usage:
bayerpattern(elements,mode,labels,color)
Where:
| Parameter | Description |
elements | Specifies the number of RGB sub-pixel, either vector [n x m] or scalar [n x n]. |
mode(optional) | Specifies the bayerpattern:'BGGR' (default)'GBRG''GRBG''RGGB' |
labels(optional) | Plot row and column numbers:'on''off' (default) |
color(optional) | Specifies the RGB pixel colours, default: [1 0 0; 0 1 0; 0 0 1] |
Examples
Create ‘BGGR’ bayerpattern with [6 x 6] sub-pixel:
bayerpattern(6)
Result:

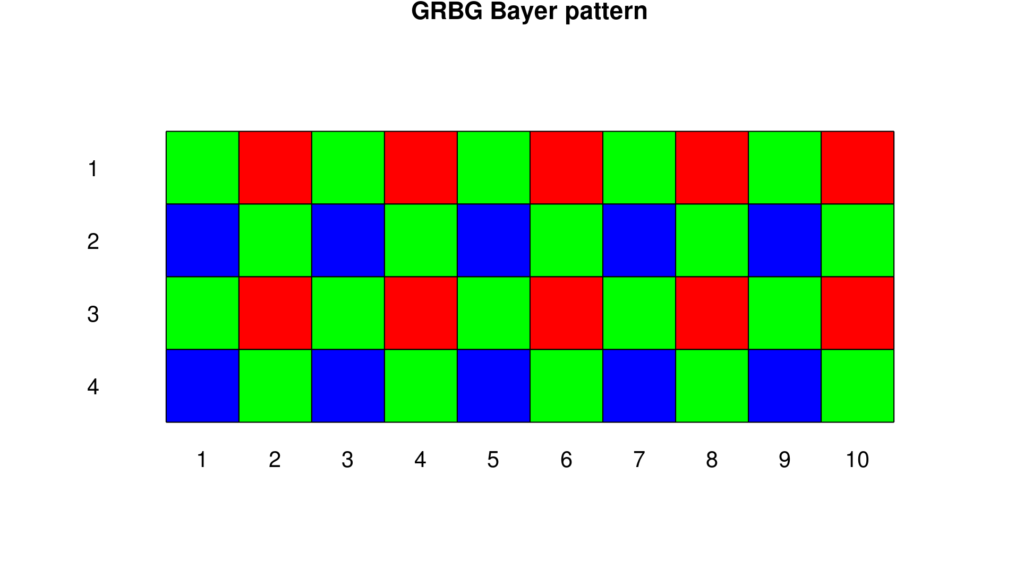
Create ‘GRBG’ bayer pattern with [4 x 10] sub-pixel, row and column numbering enabled:
bayerpattern([4 10],'GRBG','on')
Result:

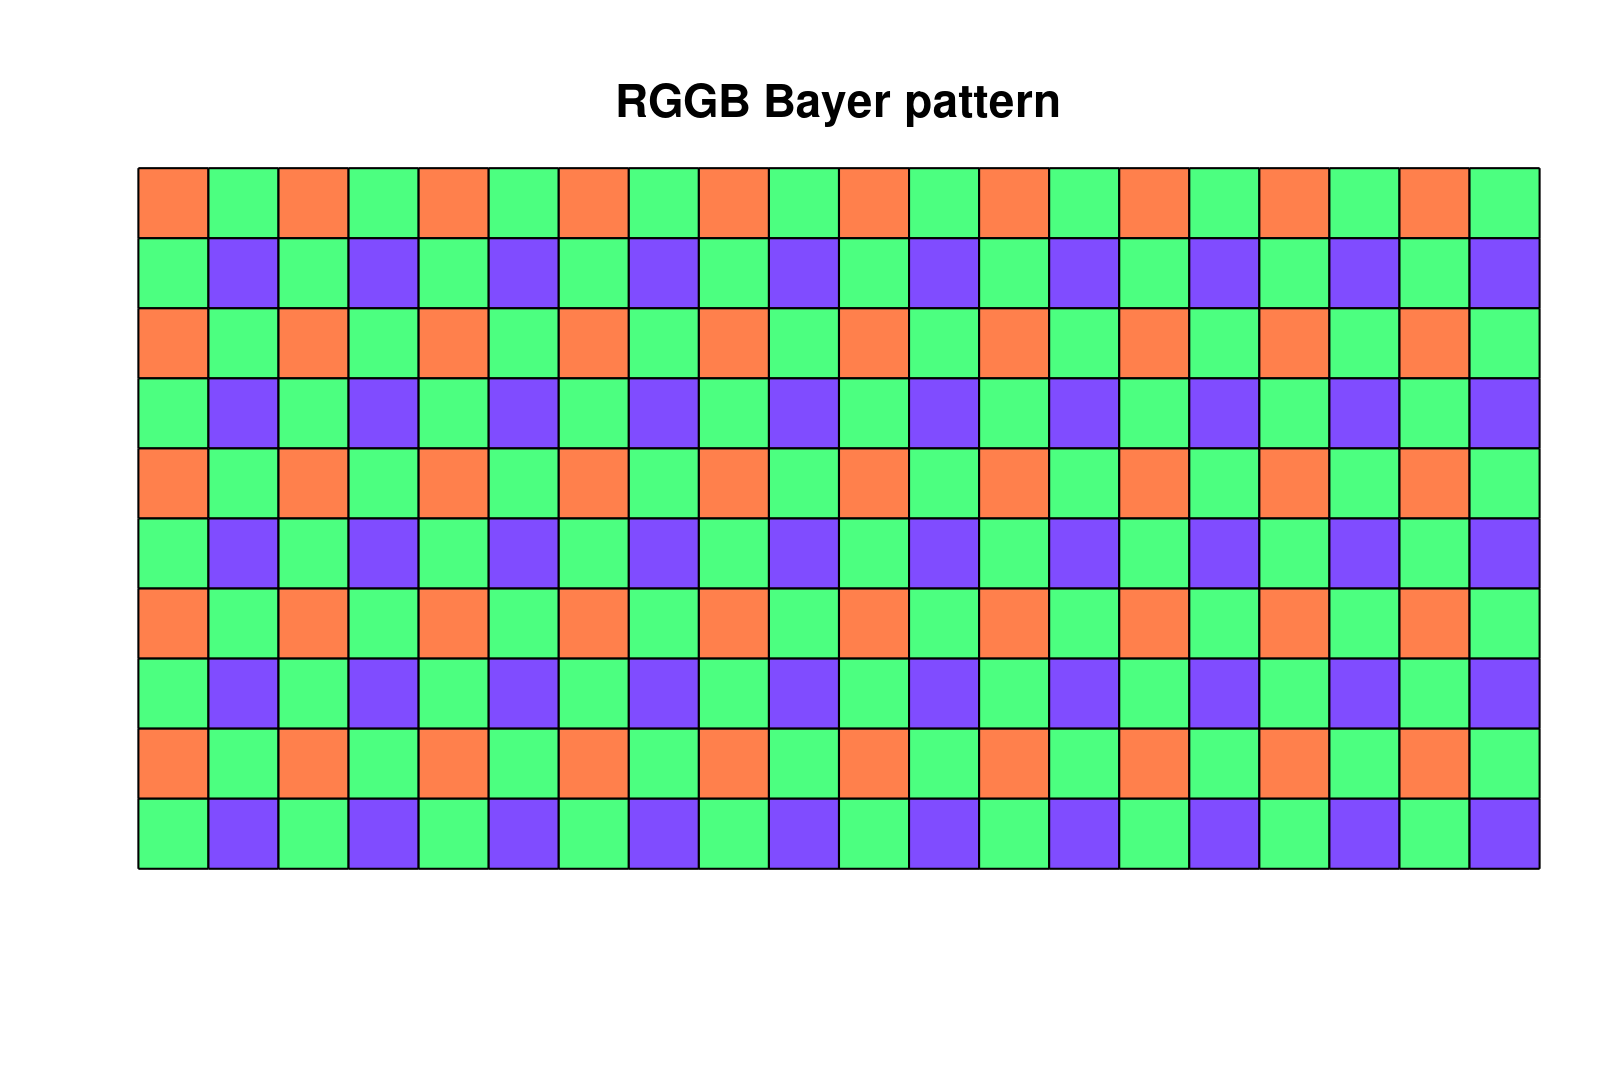
Create ‘RGGB’ bayer pattern with [10 x 20] sub-pixel, row and column numbering disabled and with specified colours:
bayerpattern([10 20],'RGGB','off',[1 0.5 0.3;0.3 1 0.5;0.5 0.3 1])
Result:
