xyz2srgb
The xyz2srgb function calculates the transformation of CIE 1931 x,y,z chromaticity coordinates to srgb for plotting in Matlab or Octave.
Usage:
srgb = xyz2srgb(xyz,'wp','method')
Where:
| Parameter | Description |
srgb | Is the resulting srgb triplet vector or matrix [r g b]. |
xyz | Is the CIE xyz input triplet vector or matrix [x y z]. |
'wp' | Specifies the reference whitepoint, see ciewhitepoint below or use a vector triplet [x y z]. Default: ‘D65’ |
'method' | Chromatic adaptation method: – ‘XYZ’ (default) – ‘vonKries’ – ‘Bradford’ |
Example:
Transformation of CIE 1931 x,y,z to srgb chromaticity and back:
xyz = [0.2905 0.3405 0.3261]
srgb = xyz2srgb(xyz)
xyz = srgb2xyz(srgb)
See also: srgb2xyz
Result:
xyz  = 0.2905    0.3405    0.3261
srgb = 0.5424    0.6428    0.5761
xyz  = 0.2905    0.3405    0.3261
Transformation of CIE 1931 x,y,z to srgb chromaticity and back using reference whitepoint ‘D65’:
xyz = [0.2905 0.3405 0.3261]
srgb = xyz2srgb(xyz,'D50')
xyz = srgb2xyz(srgb,'D50')
See also: srgb2xyz
Result:
xyz  =  0.2905   0.3405   0.3261
srgb =  0.4729   0.6493   0.6664
xyz  =  0.2905   0.3405   0.3261
Transformation of CIE 1931 x,y,z to srgb chromaticity and back using reference whitepoint ‘D50’ and ‘Bradford’ chromatic adaption method:
xyz = [0.2905 0.3405 0.3261]
srgb = xyz2srgb(xyz,'D50','Bradford')
xyz = srgb2xyz(srgb,'D50','Bradford')
See also: srgb2xyz
Result:
xyz  = 0.2905   0.3405   0.3261
srgb = 0.4842   0.6492   0.6662
xyz  = 0.2905   0.3405   0.3261
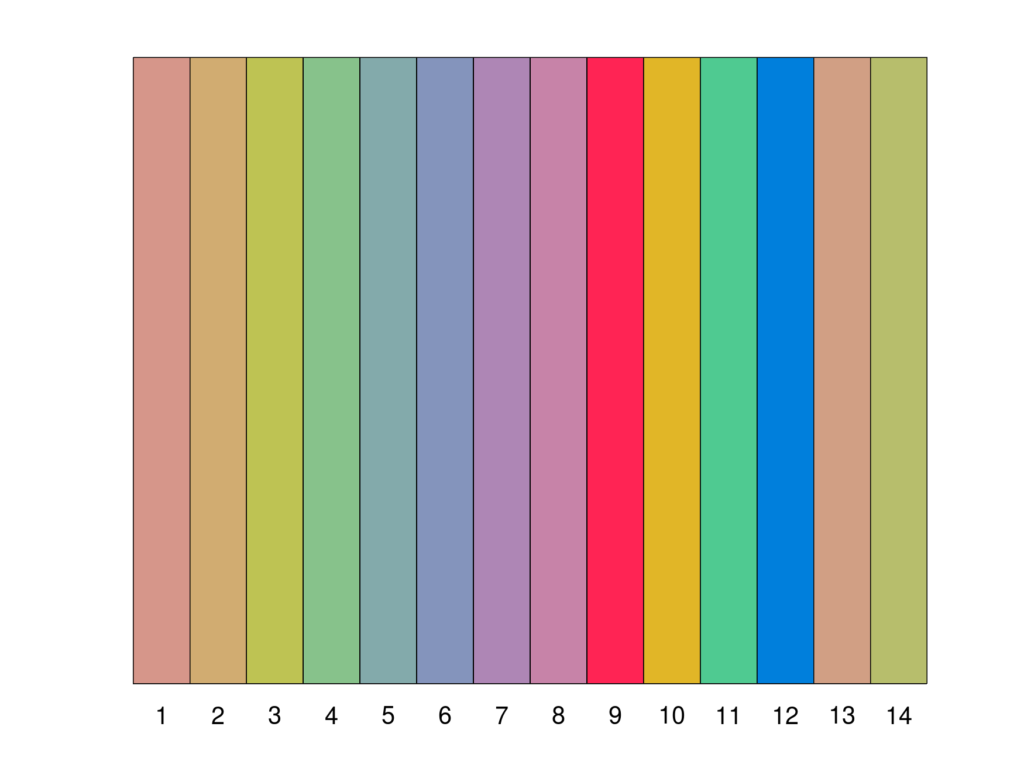
Plot CRI test colours:
lam = 380:780;
spec = ciespec(lam,'CRI');
xyz = ciespec2xyz(lam,spec);
srgb = xyz2srgb(xyz);
plotcolour(srgb)
See also: ciespec, ciespec2xyz, plotcolours
Result:
Reference:
IEC 61966-2-1:1999, Multimedia systems and equipment - Colour measurement and management - Part 2-1: Colour management - Default RGB colour space - sRGB. Genf, Switzerland: International Electrotechnical Commission (IEC), 1999. URL: https://webstore.iec.ch/publication/6168
Chromatic adaptation: http://www.brucelindbloom.com/Eqn_ChromAdapt.html