The texify function changes the text interpreter of all text elements in a figure to LaTeX.
Usage:
texify(graphicshandle)
Where:
| Parameter | Description |
graphicshandle(optional) | Is figure or axes handle. |
Examples:
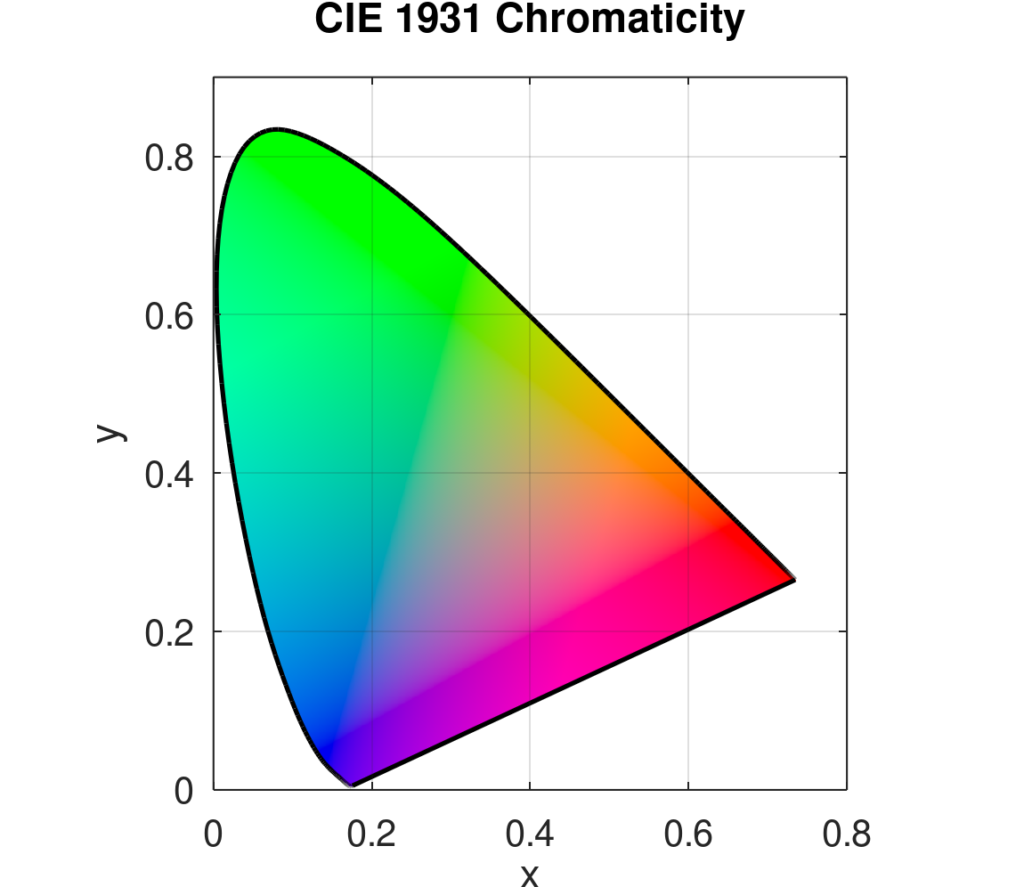
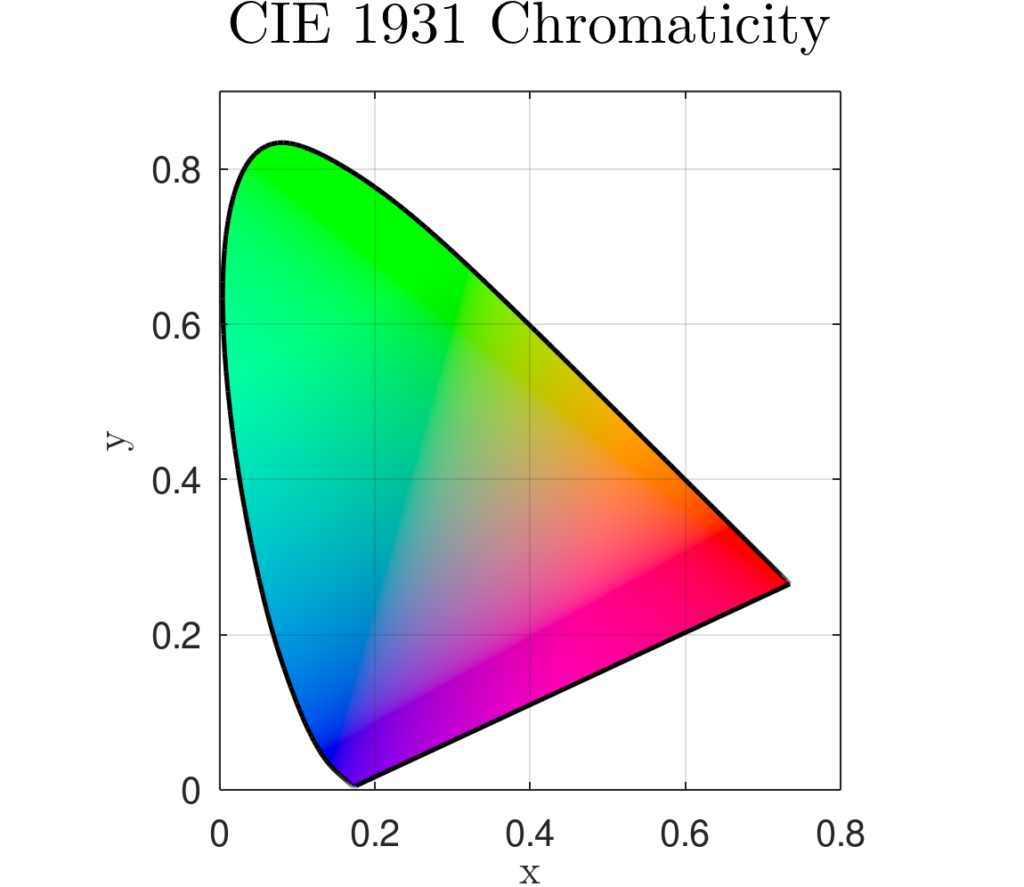
Change text appearance of all text elements of the current figure:
plotciexy

texify
Result:
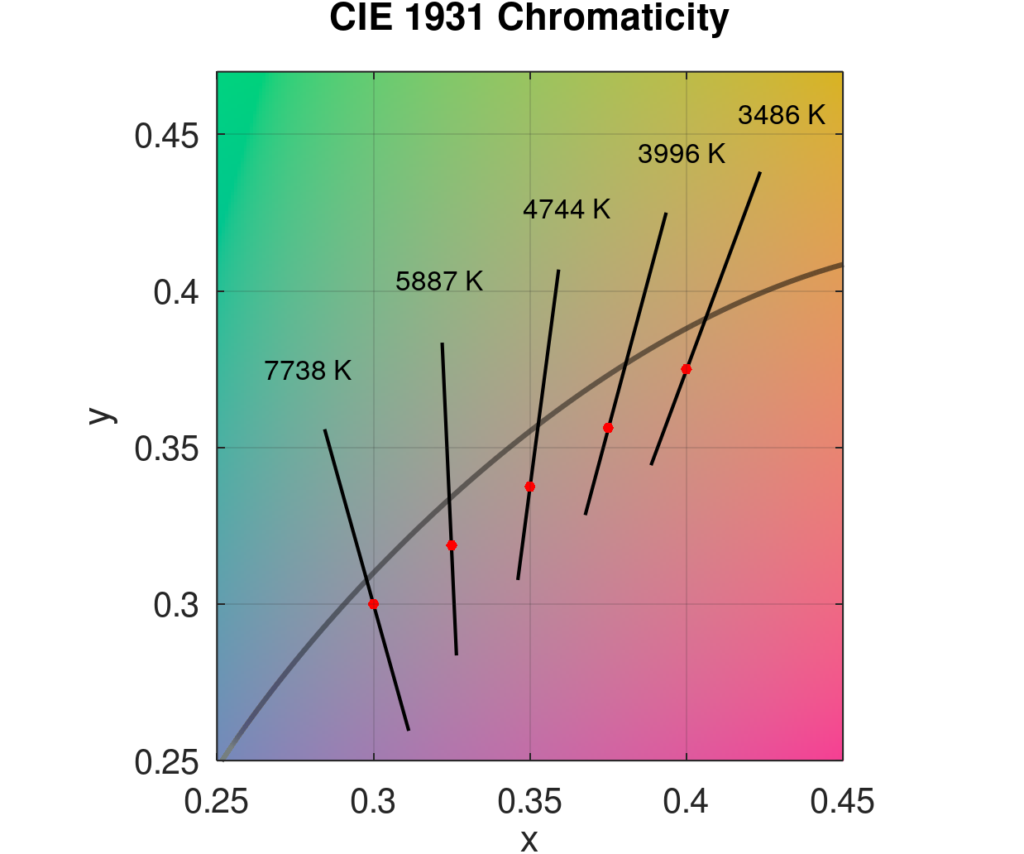
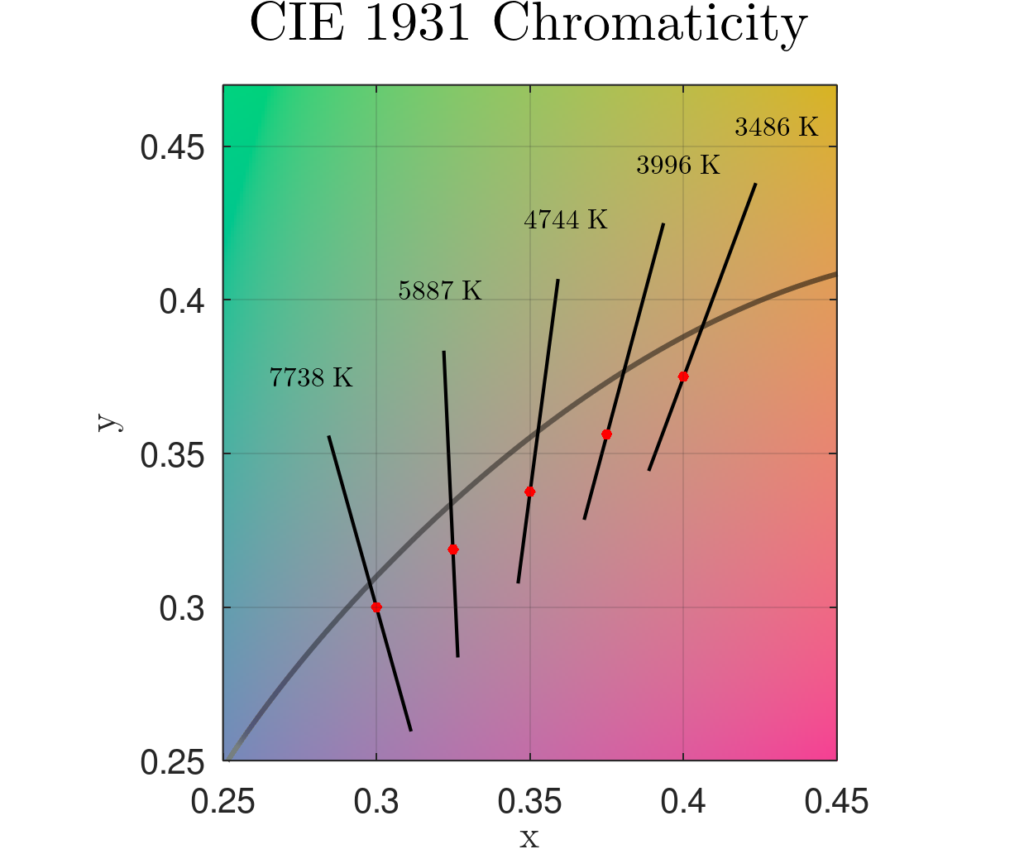
Change appearance of all text elements of figure 1:
f = figure(1);

x = linspace(0.3,0.4,5);
y = linspace(0.3,0.375,5);
plotciexy(x,y,'marker','.','markercolor',...
[1 0 0],'planck','on','CCT','value','zoom',[0.25 0.45 0.25 0.47])

texify(f)
Result:
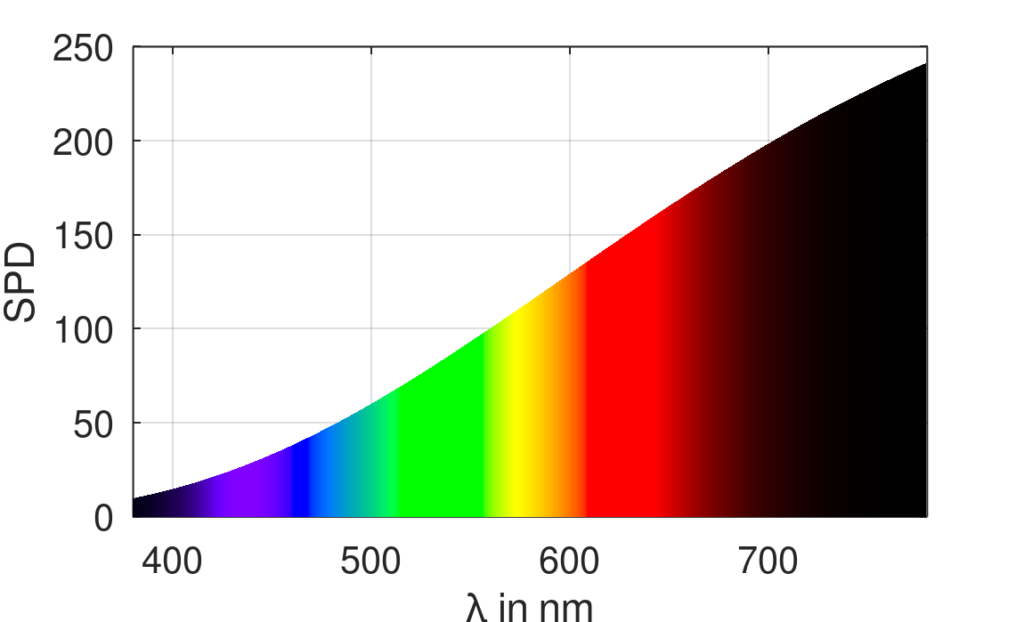
Change text appearance of all text elements, including LaTeX commands:
lam = 380:780;
spec = ciespec(lam,'A');
plotspec(lam,spec)

texify
xlabel('$\lambda$ in nm')
Result: