plottregenza
The plottregenza function creates a 2D illustration of the Tregenza sky hemisphere.
See also: plotskydirecto
Usage:
plottregenza(values,clr,clabel,info,fontsize,sun)
Where:
| Parameter | Description |
values | Contains the to be plotted data as 145\times1 vector or 145\times2 matrix. The first column sets the patch data, the second is for additional false-colours illustration, e.g. luminance and CCT in one illustration. |
clr | Specifies the patch colours: – 145\times3 matrix to specify each patch colour. – 1\times3 vector to specify an uniform patch colour. – ‘w’ for white – ‘gray’ for grayscales with colourbar (default) – ‘clr’ for false-colours with colourbar |
clabel | Specifies the colourbar label. The colourbar is only visible if two datasets are given. |
info | Is a cell array that prints additional information, up to 20 elements. Elements can be empty or incomplete. |
fontsize | Specifies the fontsize of the values, numeric, default 8. |
sun | Specifies the sun position, 1\times2 vector [azimuth elevation]. |
Examples
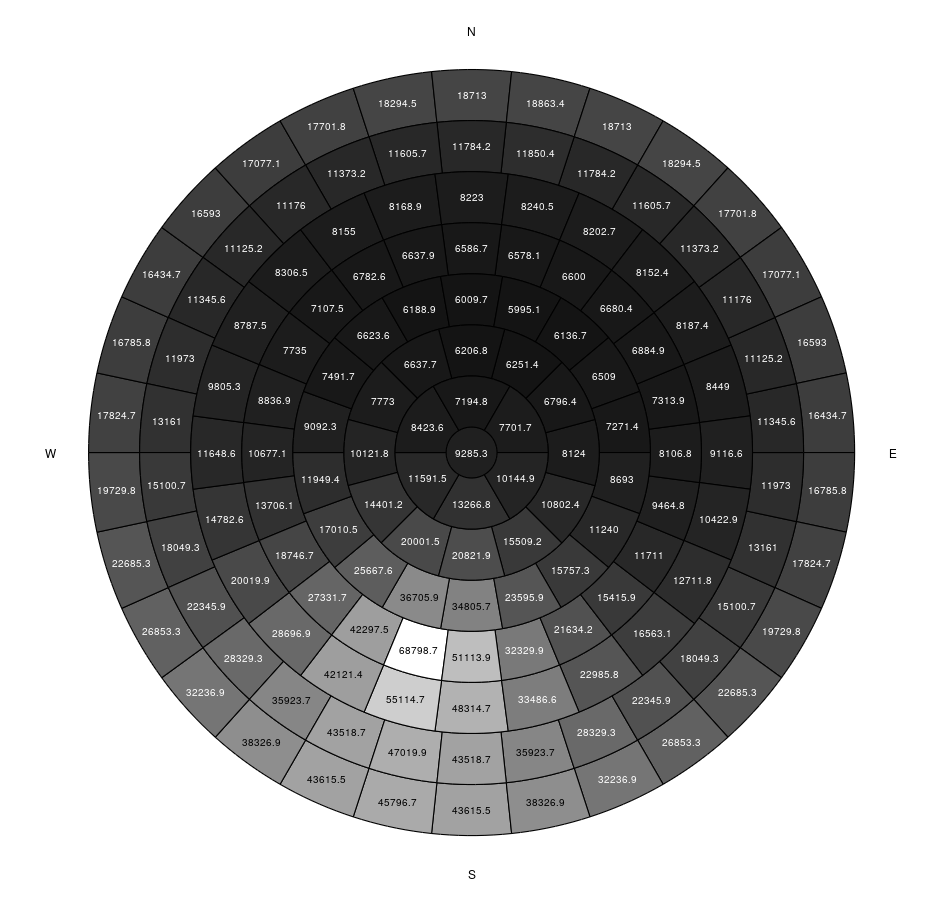
Plot CIE sky 12 at \alpha = 192° and \gamma = 42° with resulting horizontal illuminance of E_h = 50000~\textrm{lx}:
L = ciesky(12,192,42,'Eh',50000);
plottregenza(L)
See also: ciesky
Result:
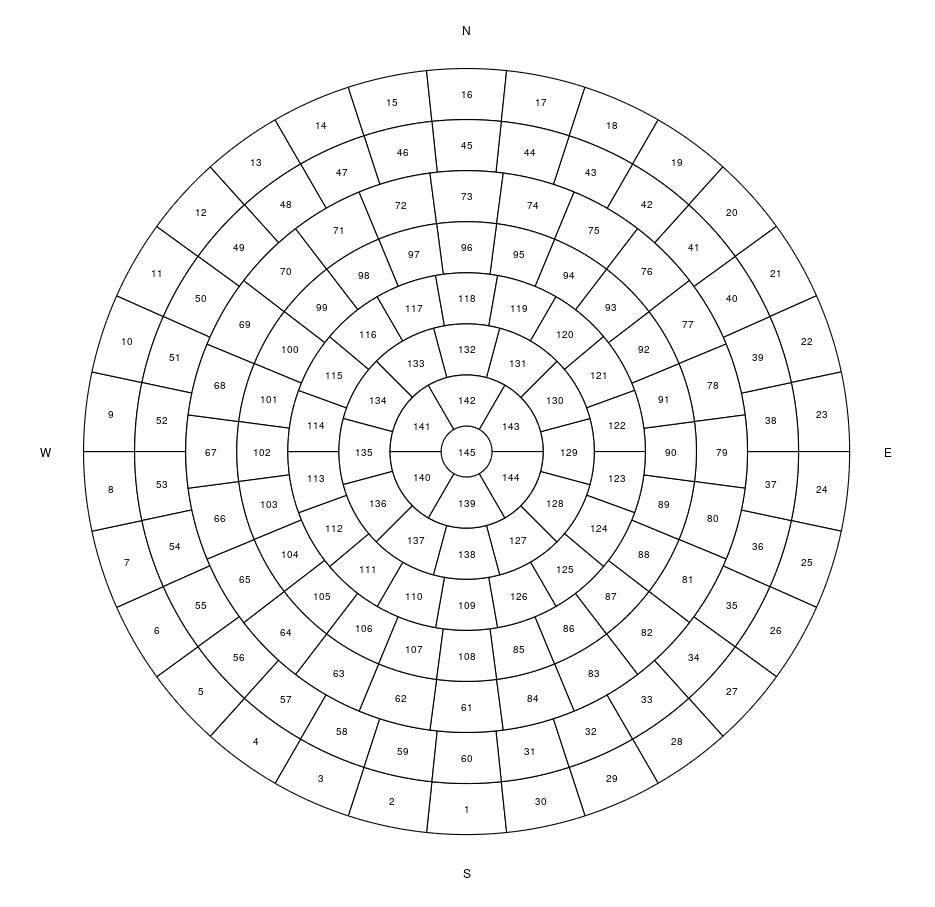
Plot Tregenza patch numbers with white patches:
plottregenza(1:145,'w')
Result:
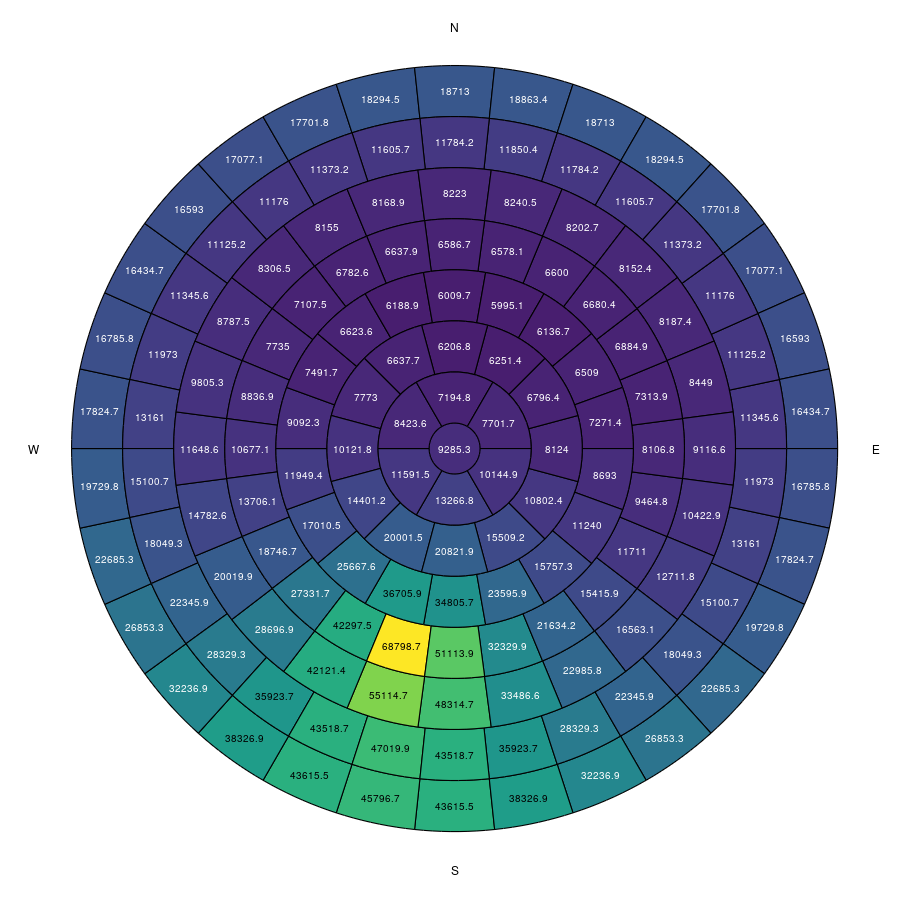
Plot CIE sky 12 at \alpha = 192° and \gamma = 42° with resulting horizontal illuminance of E_h = 50000~\textrm{lx} in false-colours:
L = ciesky(12,192,42,'Eh',50000);
plottregenza(L,'clr')
See also: ciesky
Result:
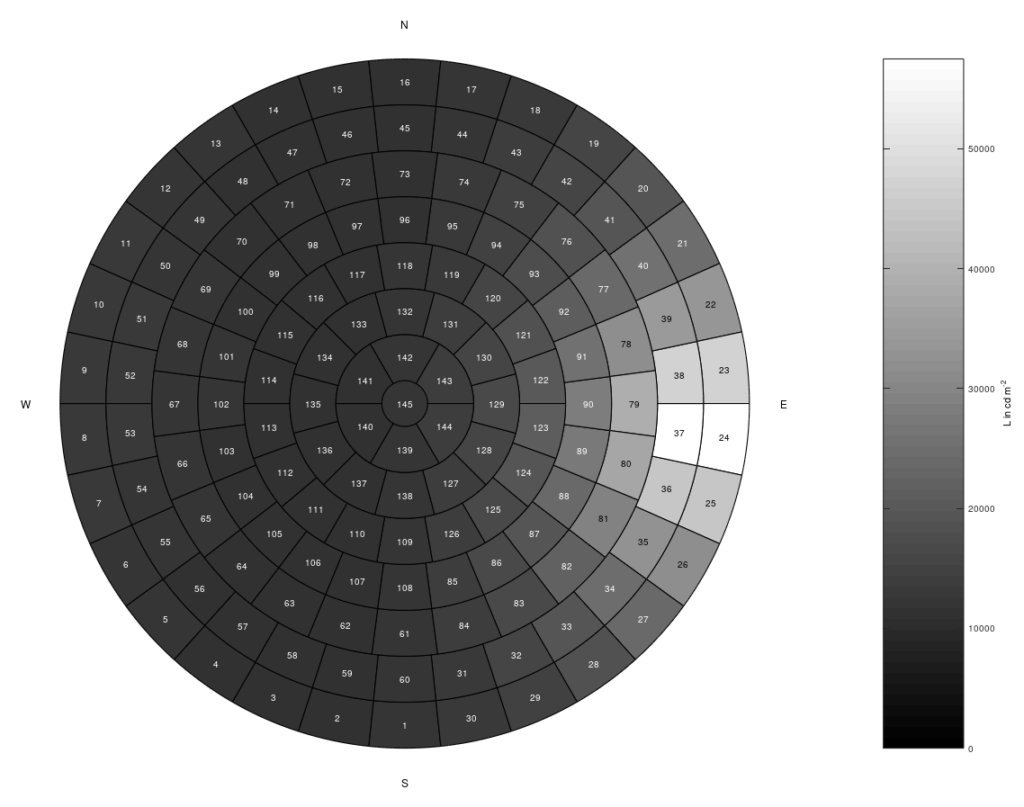
Plot CIE sky 7 at \alpha = 95° and \gamma = 12° with resulting horizontal illuminance of E_h = 50000~\textrm{lx} with patchnumbers in false-colours:
n = 1:145;
L = ciesky(7,95,12,'Eh',50000);
plottregenza([n' L],'gray','L in cd m^{-2}')
See also: ciesky
Result:
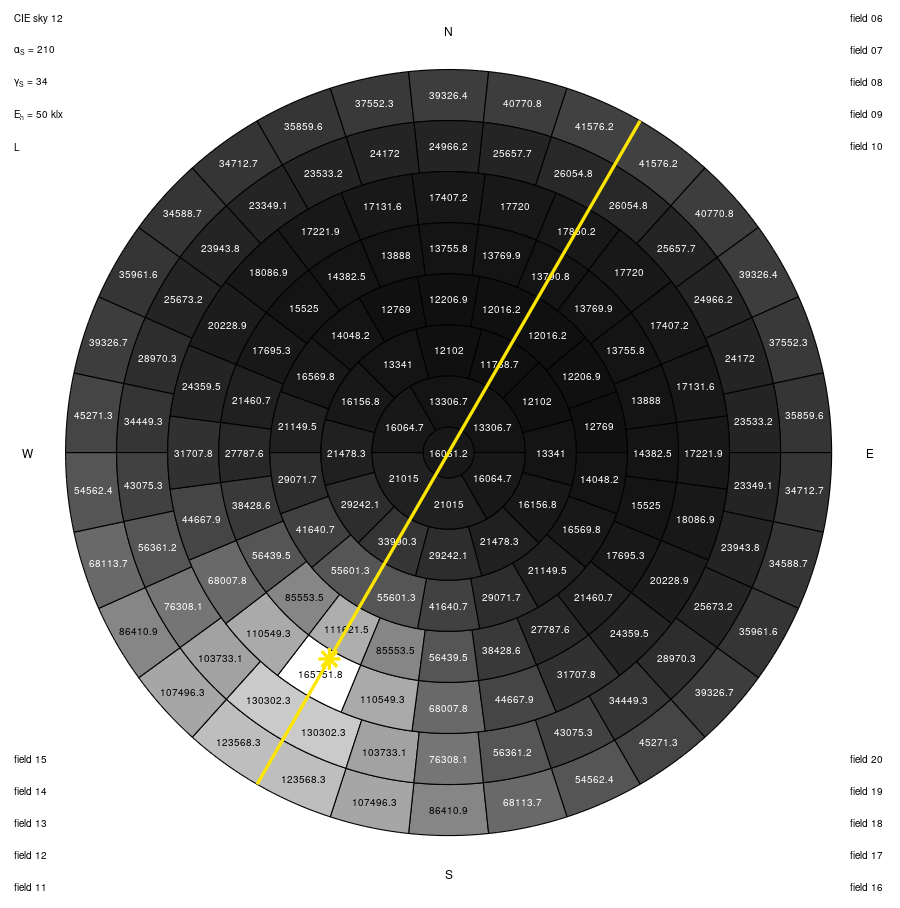
Plot CIE sky 12 at \alpha = 210° and \gamma = 34° with resulting horizontal illuminance of E_h = 100\,000~\textrm{lx} with sun position and info labels:
t = {'CIE sky 12','\alpha_S = 210','\gamma_S = 34','E_h = 50 klx','L',...
     'field 06','field 07','field 08','field 09','field 10',...
     'field 11','field 12','field 13','field 14','field 15',...
     'field 16','field 17','field 18','field 19','field 20'};
L = ciesky(12,210,34,'Eh',100000);
plottregenza(L,'gray',[],t,8,[210 34])
See also: ciesky
Result:
References
Peter Roy Tregenza: Subdivision of the sky hemisphere for luminance measurements. In: Lighting Research and Technology, vol. 19, no. 1, pp. 13-14, 1987, DOI: 10.1177/096032718701900103. URL: https://journals.sagepub.com/doi/10.1177/096032718701900103