plotspecslice
The plotspecslice function creates an illustration of spectral false colour slices of several input spectra. The spectral intensity is displayed via the false colours and the corresponding colour bar.
Usage:
plotspecslice(lam,spec,label,max)
Where:
| Parameter | Description |
lam | Specifies the spectra wavelengths. |
spec | Is the input spectra matrix. |
label | Defines the colour bar label. |
max | Sets the colour bar maximum. |
Examples
Plot normalized black body spectra:
% define lambda
lam = 380:780;
% define CCTs
T = [3000:500:9000];
% get black body spectra
spec = planck(T,lam);
% normalize spectra
spec = spec./max(spec')';
% plot spectral slices
plotspecslice(lam,spec)
% set y-labels
yticklabels(T)
ylabel('CCT')
See also: planck
Result:
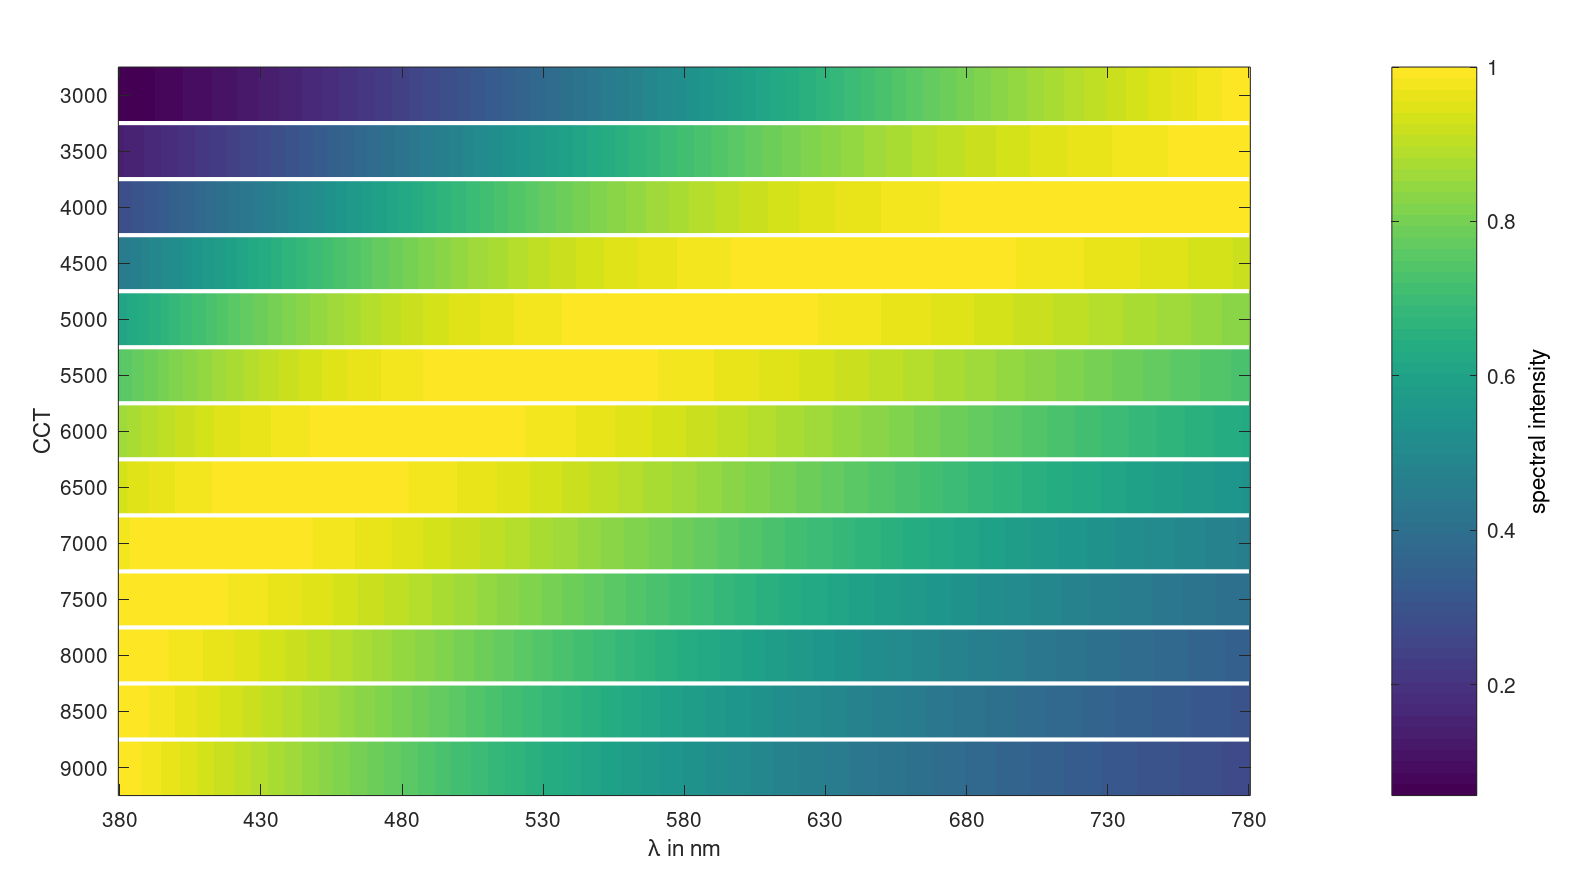
One can see, that with increassing temperatures the spectral power maximum is shifting to lower wavelengths.
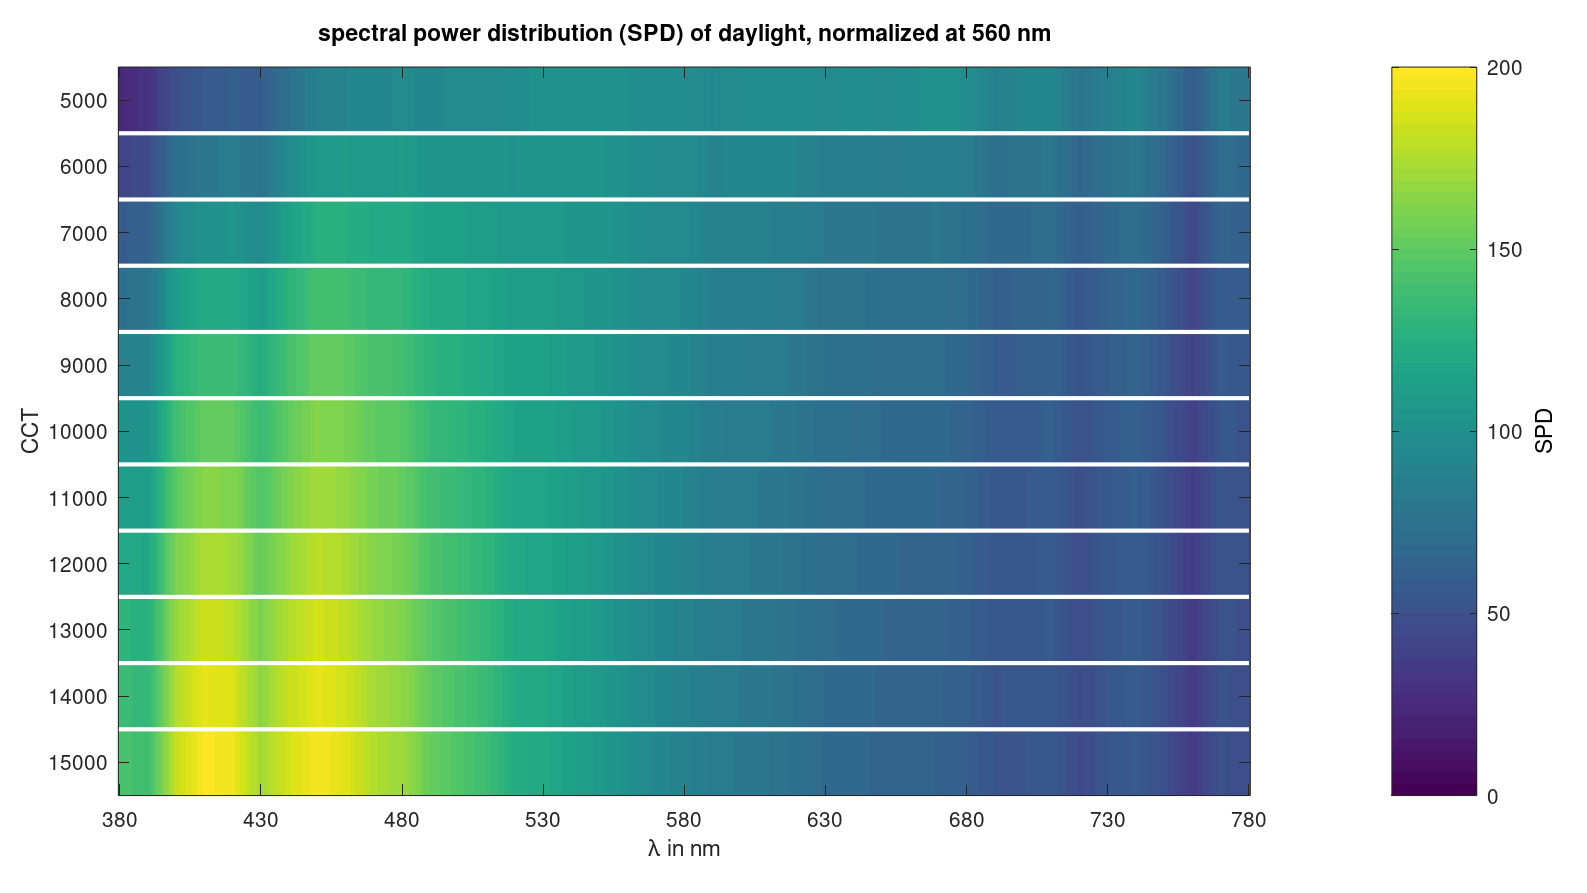
Plot diverse daylight spectra and set colourbar label and maximum:
% define wavelengths
lam = 380:780;
% define CCTs
T = [5000:1000:15000];
% create daylight spectra
spec = ciecct2spec(T,lam);
% plot spectral slices
plotspecslice(lam,spec,'SPD',200);
% add title and y-labels
title('spectral power distribution (SPD) of daylight, normalized at 560 nm')
ylabel('CCT')
yticklabels(T)
See also: ciecct2spec
Result:
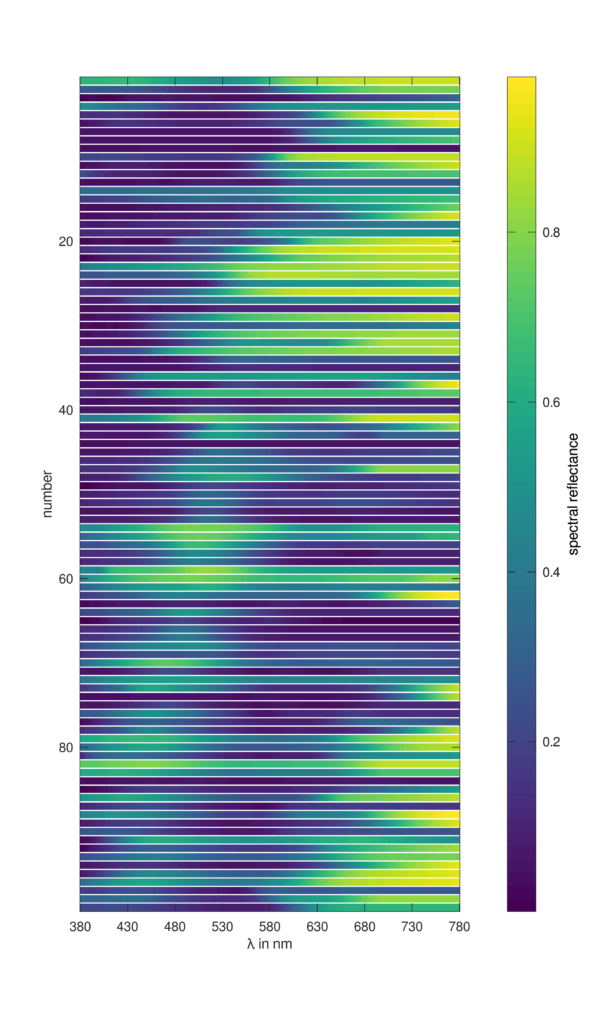
Plot spectral reflectance values of the CIE colour fidelity index references:
lam = 380:780;
spec = ciespec(lam,'CFI');
plotspecslice(lam,spec,'spectral reflectance')
See also: ciespec