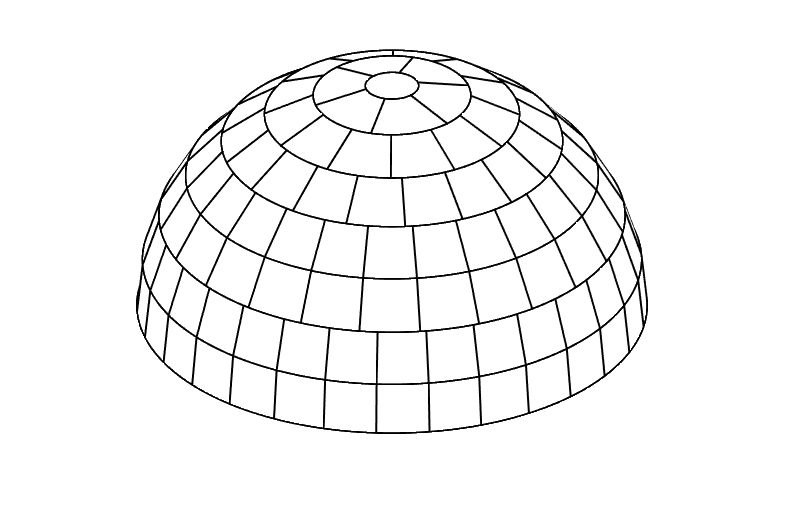
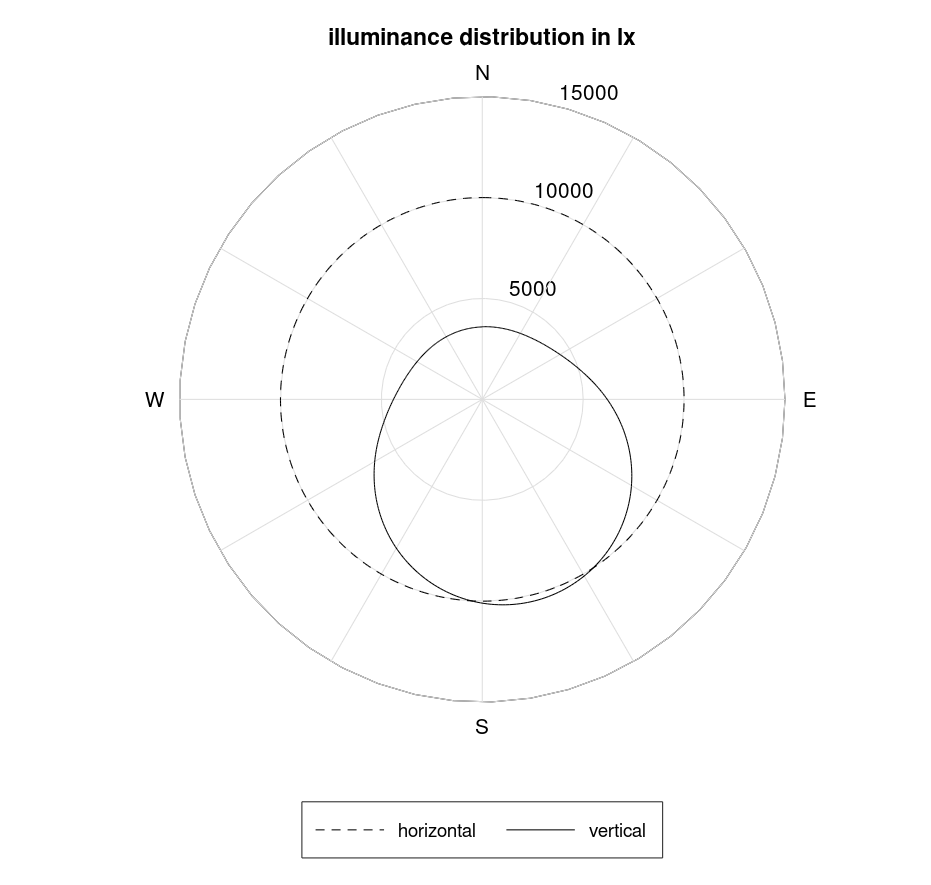
The plotpolarE function calculates the resulting horizontal and vertical illuminances for a given Tregenza luminance distribution with 145 patches and plots the resulting illuminance distribution. The Tregenza hemisphere is assumed to have 100% coverage as in figure 1 in contrast to the original Tregenza model.
See also: polardataE, plotpolarCCT

Usage:
[Eh,Ev] = polardataE(L,vdir)
Where:
| Parameter | Description |
Eh | Is the resulting horizontal illuminance E_h. |
Ev | Are the resulting vertical illuminances E_{v,i} in i vertical directions, specified by the vdir parameter. Note: this method neglects the influence of the sourrounding reflectances e.g. the environment terrain. |
L | Is the Tregenza luminance distribution in \textrm{cd}\cdot\textrm{m}^2 as 145 \times 1 vector. |
vdir | Specifies the vertical compass direction using the azimuth angle, starting in north and going clockwise, default [0:359]. For compass directions north, east, south, west use: [0 90 180 270] |
Examples
Horizontal and vertical illuminance (N,E,S,W) for CIE sky 12 with \alpha_S=180° and \gamma_S = 40°:
L = ciesky(12,180,40,'Eh',1e4);
[Eh,Ev] = plotpolarE(L,[0 90 180 270])
See also: ciesky
Result:

Eh = 10000.0
Ev =

   3.5917e+03
   6.1367e+03
   1.0112e+04
   4.4096e+03
Reference
Subdivision of the sky hemisphere for luminance measurements. In: Lighting Research and Technology, vol. 19, no. 1, pp. 13-14, 1987, (DOI: 10.1177/096032718701900103).