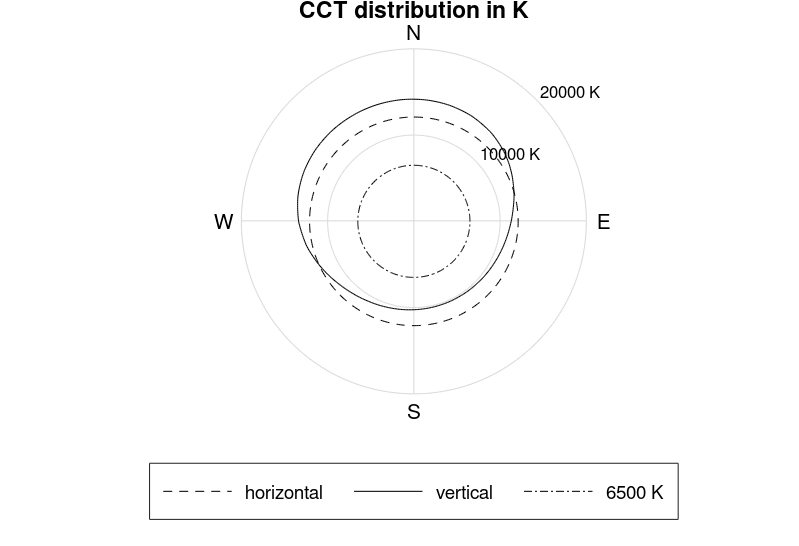
The plotpolarCCT function calculates and plots the resulting horizontal and vertical Correlated Colour Temperatures (CCTs) T_{cp,i} from the Tregenza luminance distribution with 145 patches and the colour coordinates x and y. The illustration is also known under the name spectral daylight potential diagram (SDPD), see Diakite-Kortlever and Knoop.
See also: polardataCCT, plotpolarE
Usage:
[Th,Tv] = plotpolarCCT(x,y,L,vdir)
Where:
| Parameter | Description/value |
Th | Is the resulting horizontal CCT T_{cp,h}. |
Tv | Are the resulting vertical CCTs T_{cp,v,i} in i vertical directions, specified by the vdir parameter. Note: this method neglects the influence of the sourrounding reflectances e.g. the environment terrain. |
x and y | Are the Tregenza patches CIE 1931 colour coordinates x and y as 145 \times 1 vector. |
L | Is the Tregenza luminance distribution in \textrm{cd}\cdot\textrm{m}^2 as 145 \times 1 vector. |
vdir | Specifies the vertical compass direction using the azimuth angle, starting in north and going clockwise, default [0:359]. For compass directions north, east, south, west use: [0 90 180 270] |
Examples
Horizontal and vertical illuminance (N,E,S,W) for CIE sky 12 with \alpha_S=160° and \gamma_S = 40°:
[~,~,L,~,x,y] = specsky(12,160,40);
[Th,Tv] = plotpolarCCT(x,y,L,[0 90 180 270])
See also: specsky
Result:

Th = 12093
Tv =

   14159
   11316
   10243
   13357
Reference