plotorder
The plotorder function plots several graphs in user defined colours, line styles and markers. The function allows the user to define different settings for each data set.
Usage:
h = plotorder(x,y,clr,'parameter','value')
Where:
| Parameter | Description |
h | Returns the graphic handle of the figure for further processing. |
x and y | Are vectors containing the to be plotted data. |
clr | Specifies the plot colour(s), n\times3 matrix. |
'linestyle' | Defines the line argument: ‘-‘ for solid line ‘:’ for dotted line ‘–‘ for dashed line ‘-.’ for dashed-dotted line |
'marker' | ‘*’ star ‘.’ point ‘+’ plus ‘o’ circle ‘x’ cross ‘s’ square ‘d’ diamond ‘^’ upward traingle ‘v’ downward triangle ‘<‘ triangle left ‘>’ triangle right |
Examples
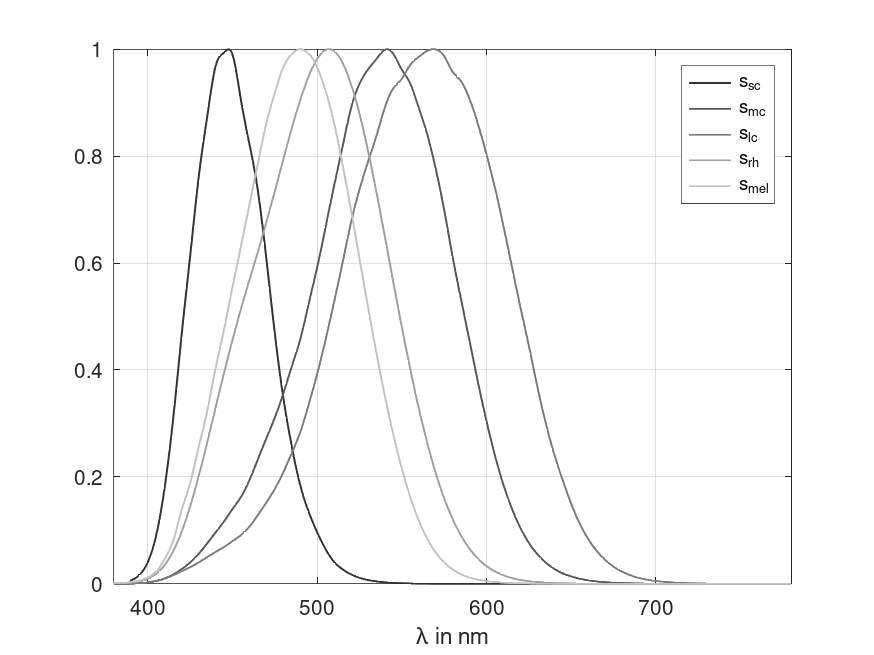
Plot \mathbf{\alpha}-opic functions in shades of gray:
lam = 380:780;
ref = ciespec(lam,'a-opic');
c = colors(5,'S',zeros(5,1));
plotorder(lam,ref,c)
xlim([380 780])
legend('s_{sc}','s_{mc}','s_{lc}','s_{rh}','s_{mel}')
xlabel('\lambda in nm')
grid on
Result:
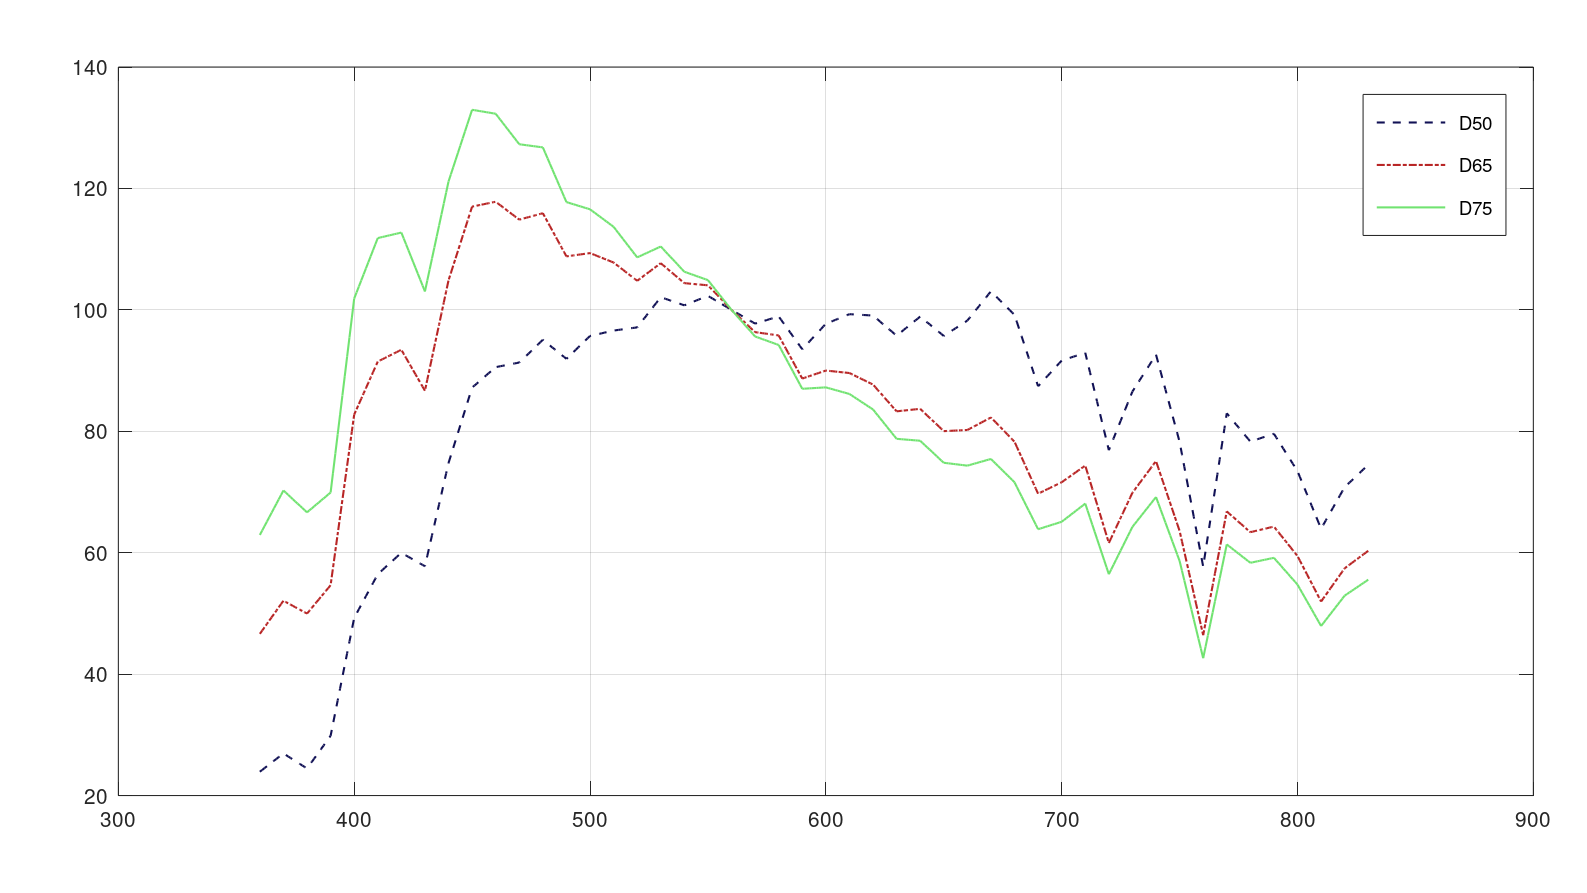
Plot standard illuminants D50, D65 and D75 with different linestyles:
lam = 360:830;
spec = ciespec(lam,{'D50','D65','D75'});
c = colours(3);
plotorder(lam,spec,c,'linestyle',{'--','-.','-'});
legend('D50','D65','D75')
grid on
One Response