plotgrid
The plotgrid function creates an iso-line, iso-colour or false-colour plot for a given meshgrid and the according data. The function also extrapolates data outside the mesh.
See also: egrid, plotisolines, plotisocolours, plotfalsecolours
Usage:
plotgrid(x,y,Y,mode,clabel,climits)
Where:
| Parameter | Description |
x and y | Are the coordinate matrices of the mesh grid, see egrid. |
Y | Is the to be plotted quantity distribution in matrix form. |
mode | Specifies the plot mode: ‘isocolor’ for iso-colour plot ‘falsecolor’ for false-colour plot ‘lines’ for iso-line plot (default) |
clabel | Defines the colourbar label in colour mode, string or char. |
| climits (optiona) | Specifies the colourbar limits in vector format in colour mode: [c1 c2] |
Examples
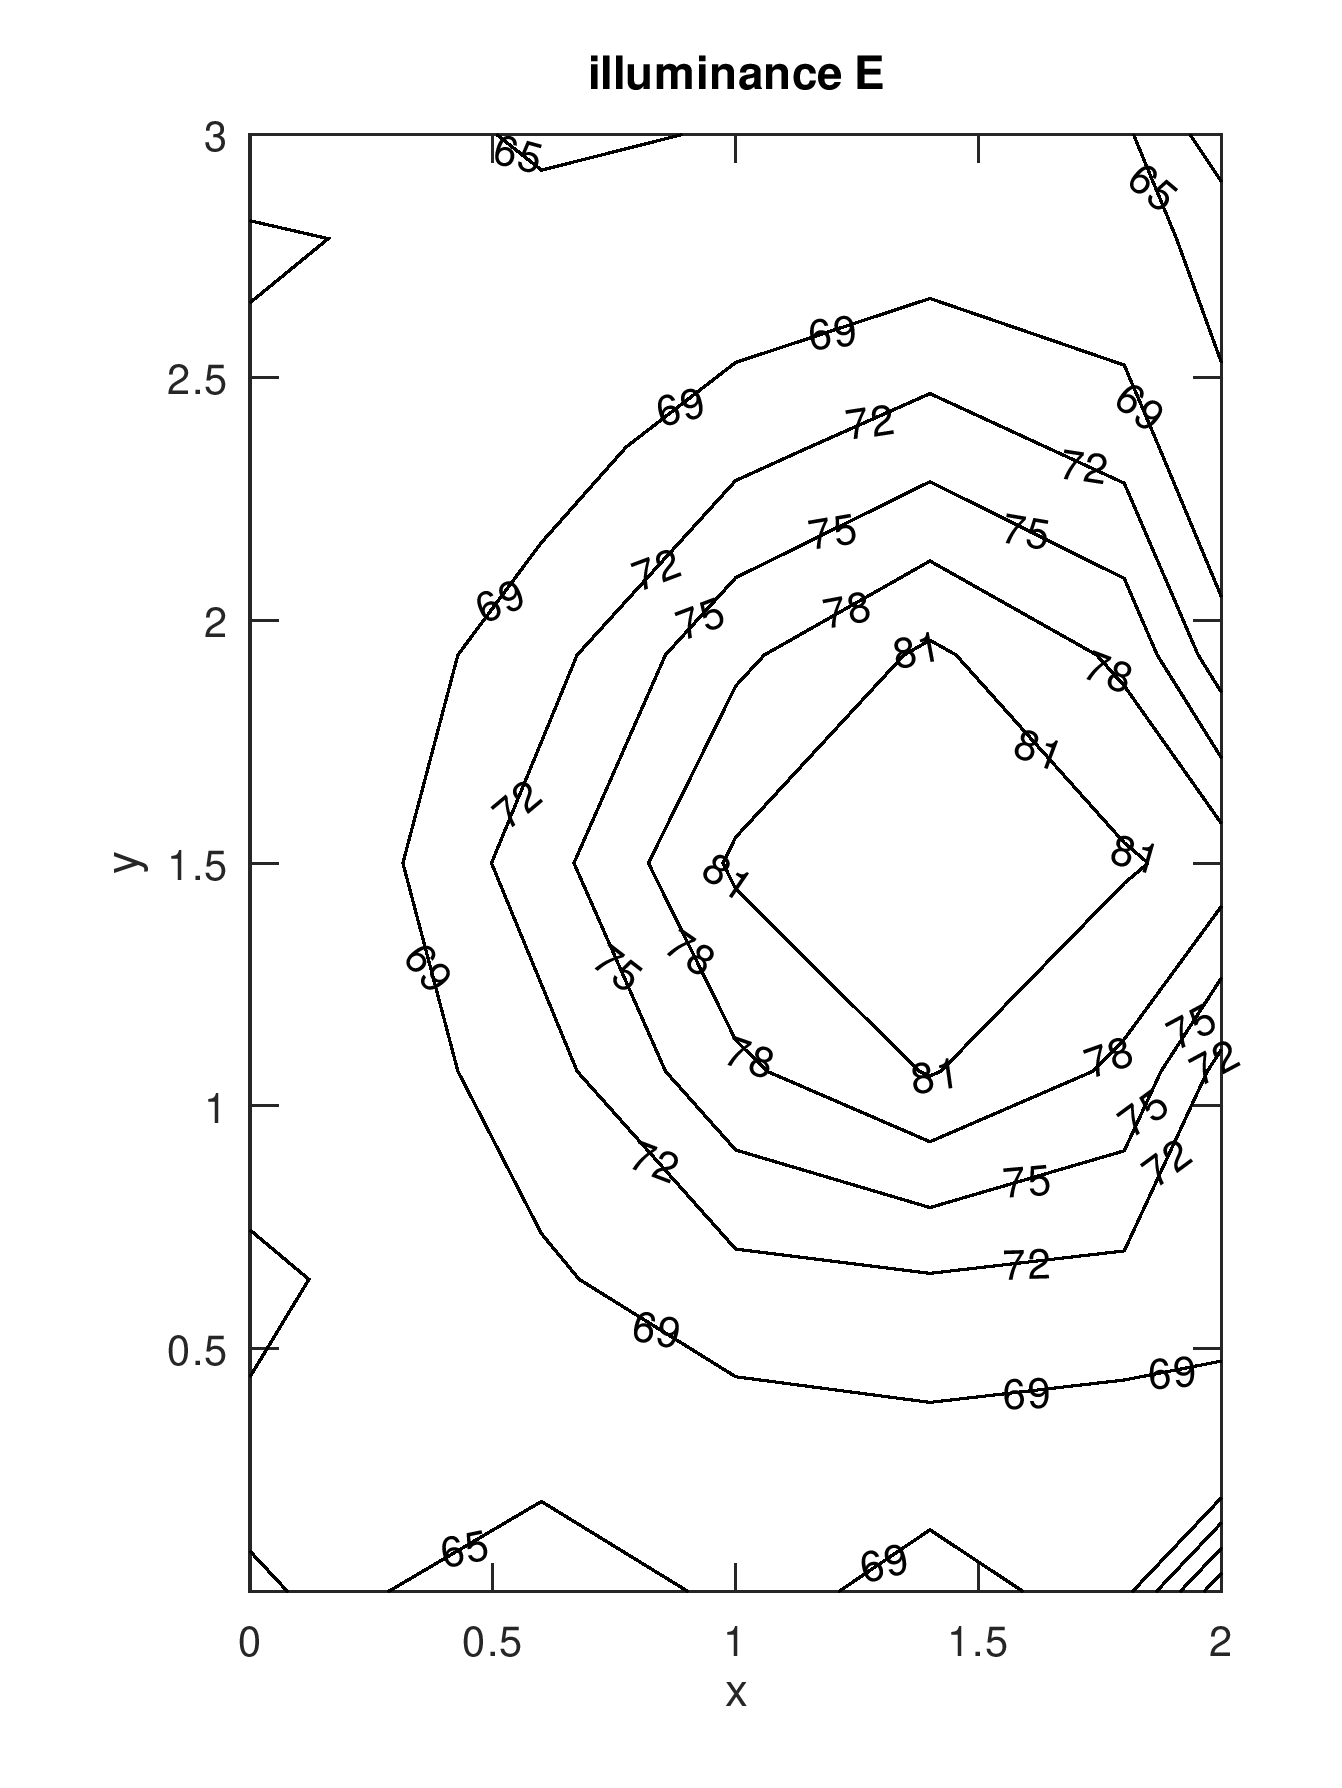
Plot illuminance measurement data for a grid determined by the egrid function:
[x,y] = egrid(2,3);

E = [65.0451 65.4281 66.6292 67.1130 66.7063
     65.4280 68.4963 71.0842 71.7268 71.1471
     66.6291 70.7887 77.3848 81.2140 77.3849
     67.1127 73.6917 81.5131 83.5850 81.3887
     66.6291 70.7887 77.3848 81.5566 77.4113
     65.4281 67.4780 70.9568 73.6784 70.8536
     65.0451 65.4280 66.1305 67.1127 66.1305];

plotgrid(x,y,E,'lines')
title('illuminance E')
See also: egrid, plotisolines
Result:
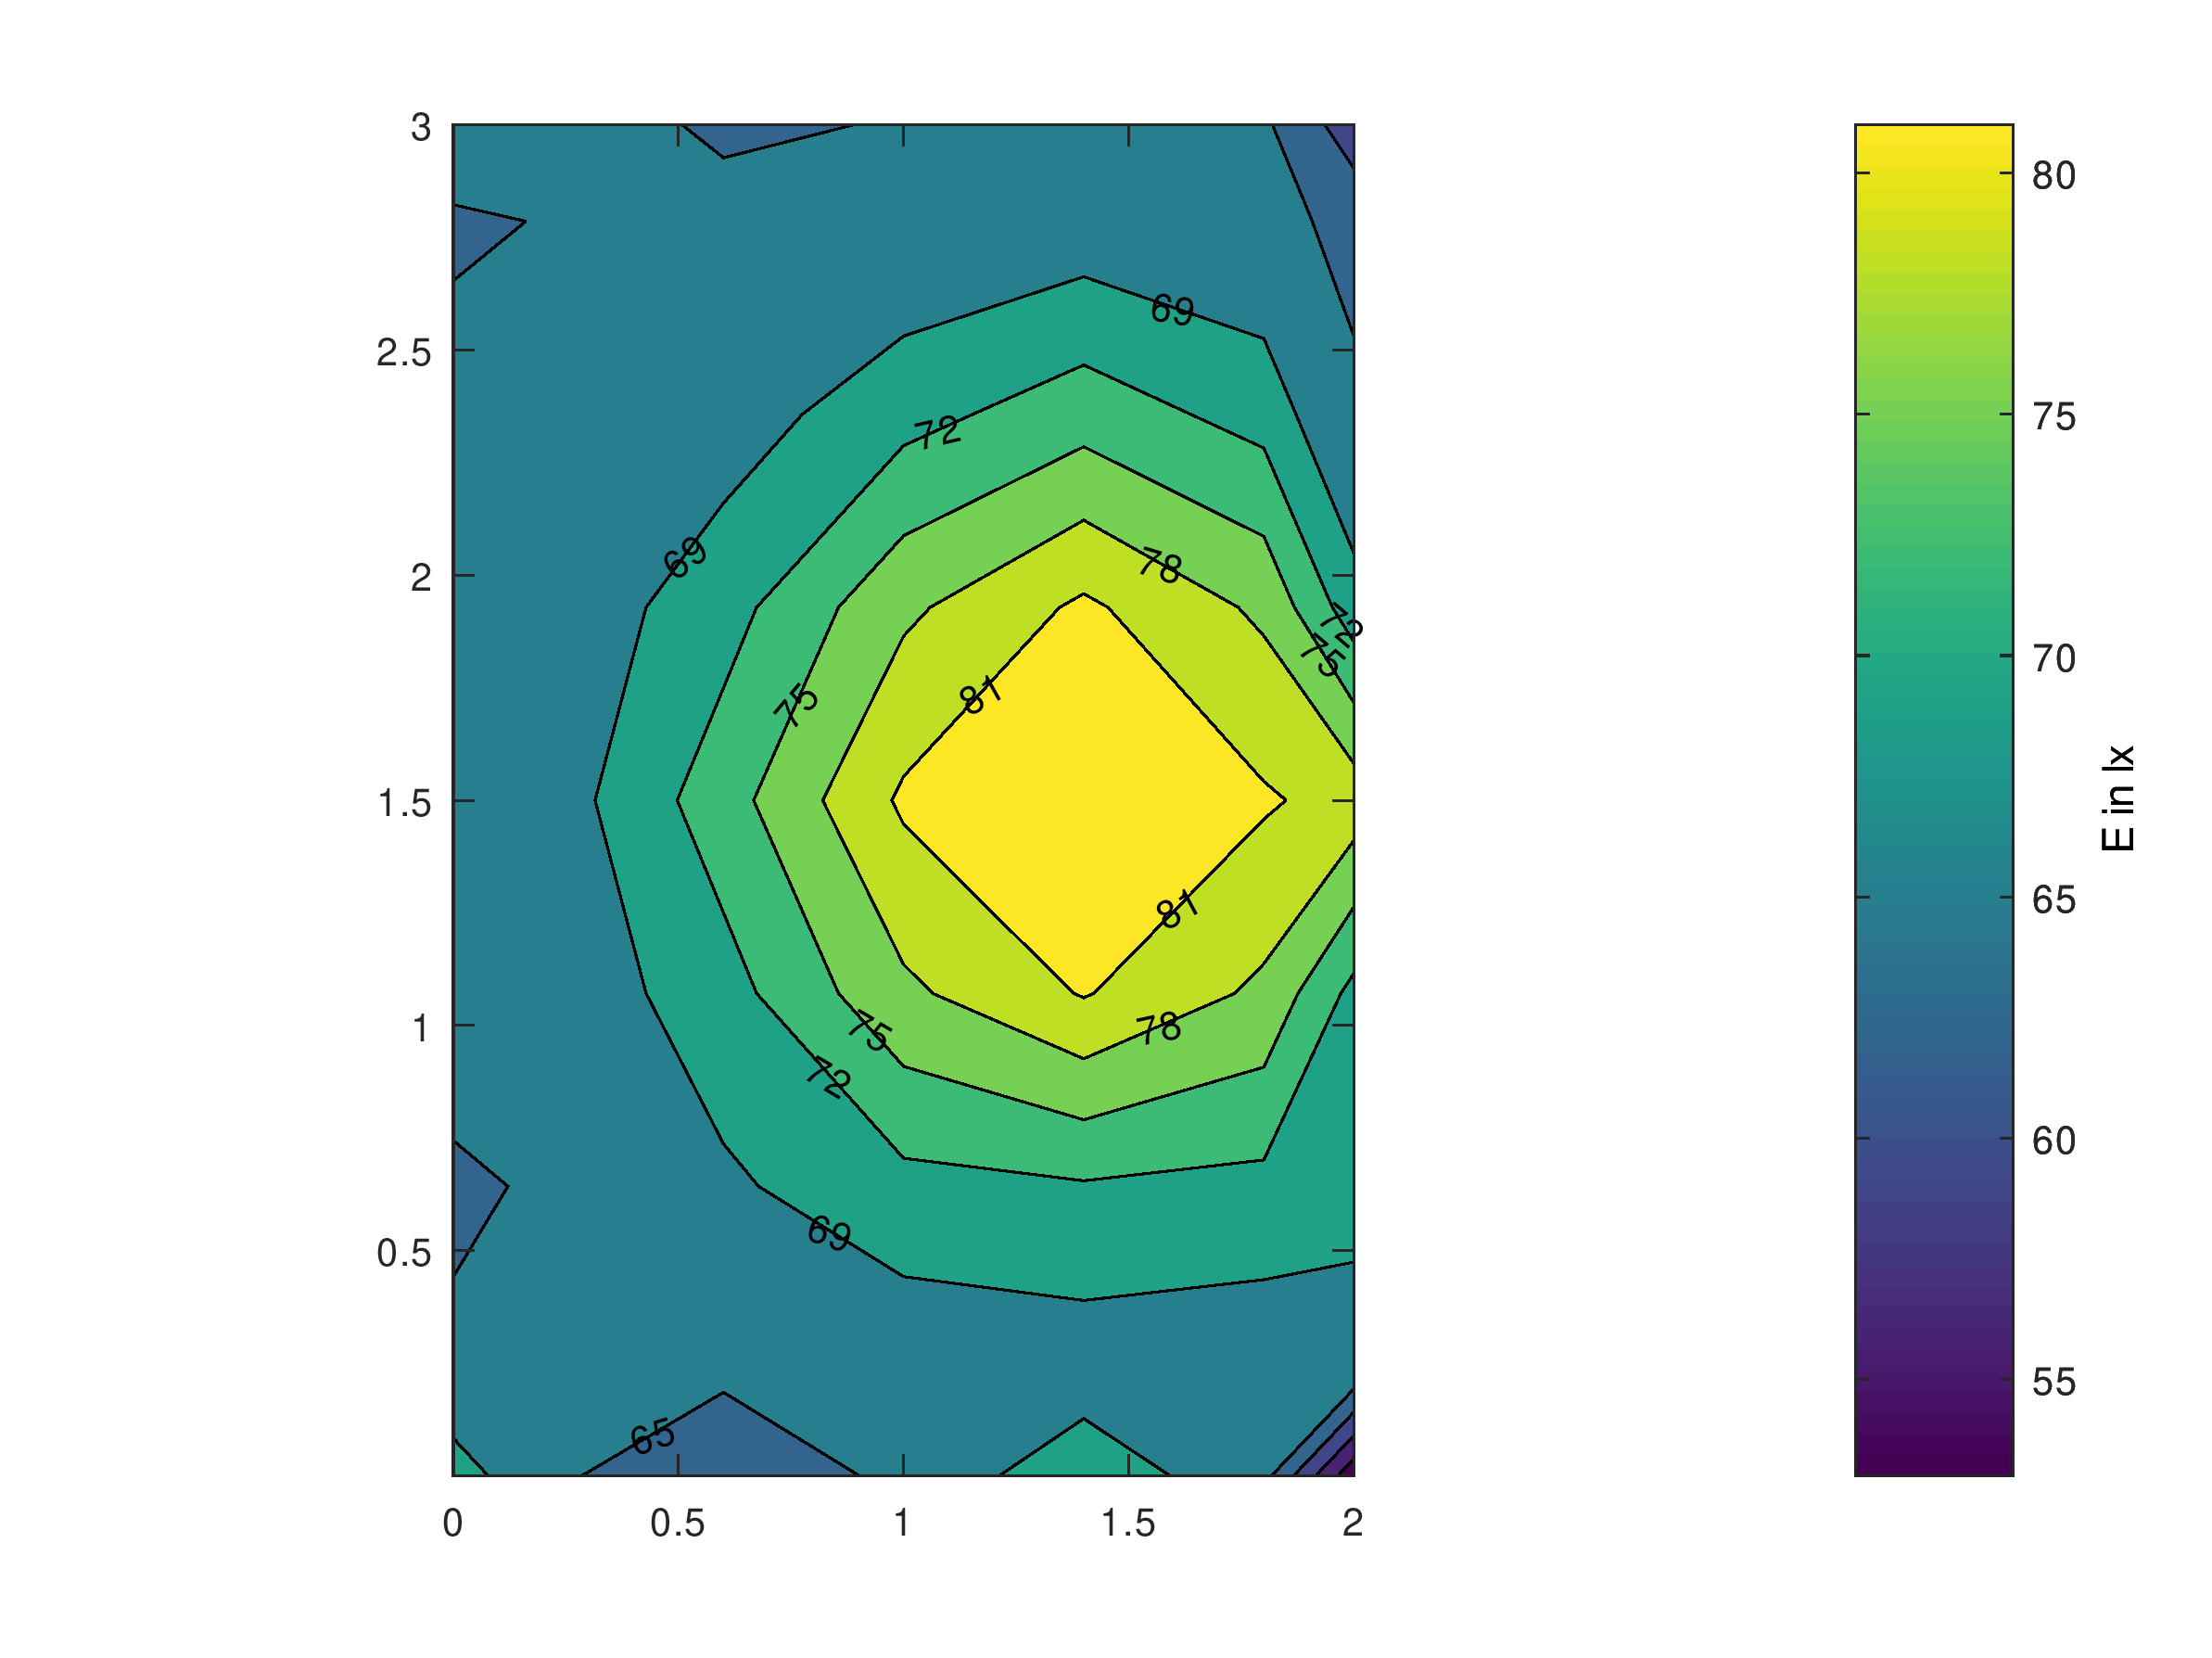
Plot illuminance measurement data for a grid determined by the egrid function using iso colours:
[x,y] = egrid(2,3);

E = [65.0451 65.4281 66.6292 67.1130 66.7063
     65.4280 68.4963 71.0842 71.7268 71.1471
     66.6291 70.7887 77.3848 81.2140 77.3849
     67.1127 73.6917 81.5131 83.5850 81.3887
     66.6291 70.7887 77.3848 81.5566 77.4113
     65.4281 67.4780 70.9568 73.6784 70.8536
     65.0451 65.4280 66.1305 67.1127 66.1305];

plotgrid(x,y,E,'isocolor','E in lx')
See also: egrid, plotisocolours
Result:
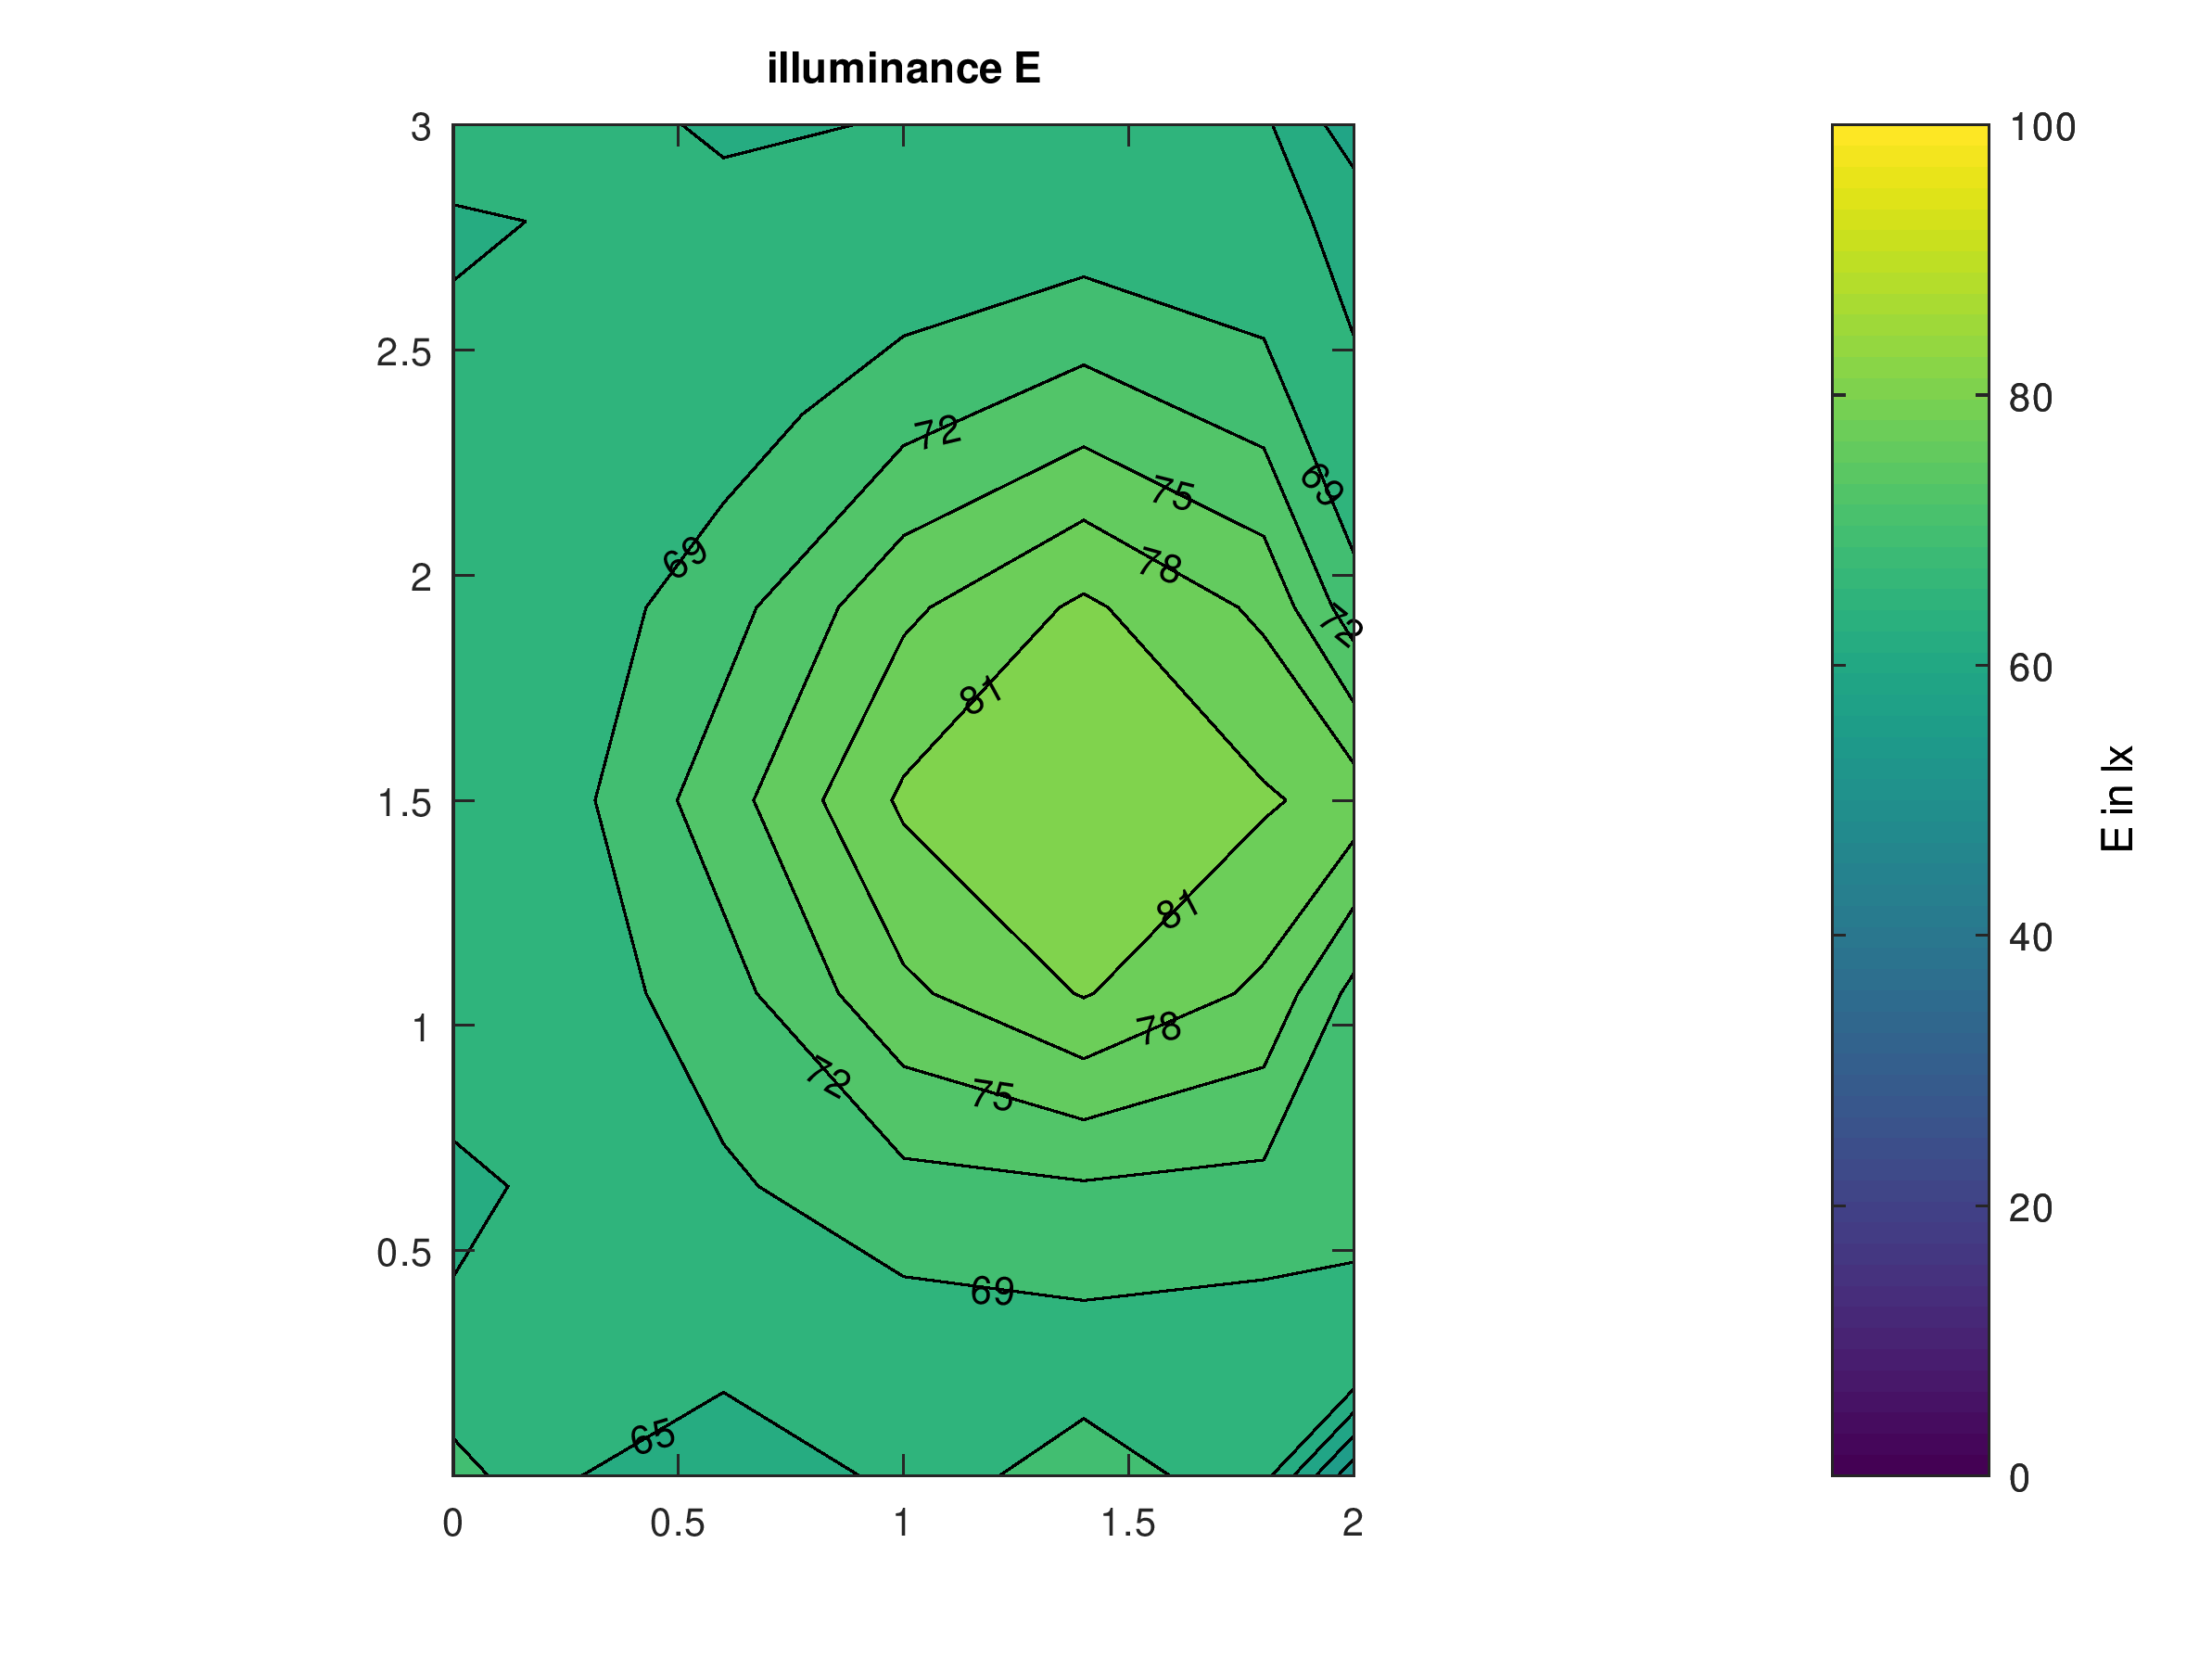
Plot illuminance measurement data for a grid determined by the egrid function using iso colours and adjust colourbar limits:
[x,y] = egrid(2,3);

E = [65.0451 65.4281 66.6292 67.1130 66.7063
     65.4280 68.4963 71.0842 71.7268 71.1471
     66.6291 70.7887 77.3848 81.2140 77.3849
     67.1127 73.6917 81.5131 83.5850 81.3887
     66.6291 70.7887 77.3848 81.5566 77.4113
     65.4281 67.4780 70.9568 73.6784 70.8536
     65.0451 65.4280 66.1305 67.1127 66.1305];

plotgrid(x,y,E,'isocolor','E in lx',[0 100])
title('illuminance E')
See also: egrid, plotisocolours
Result:
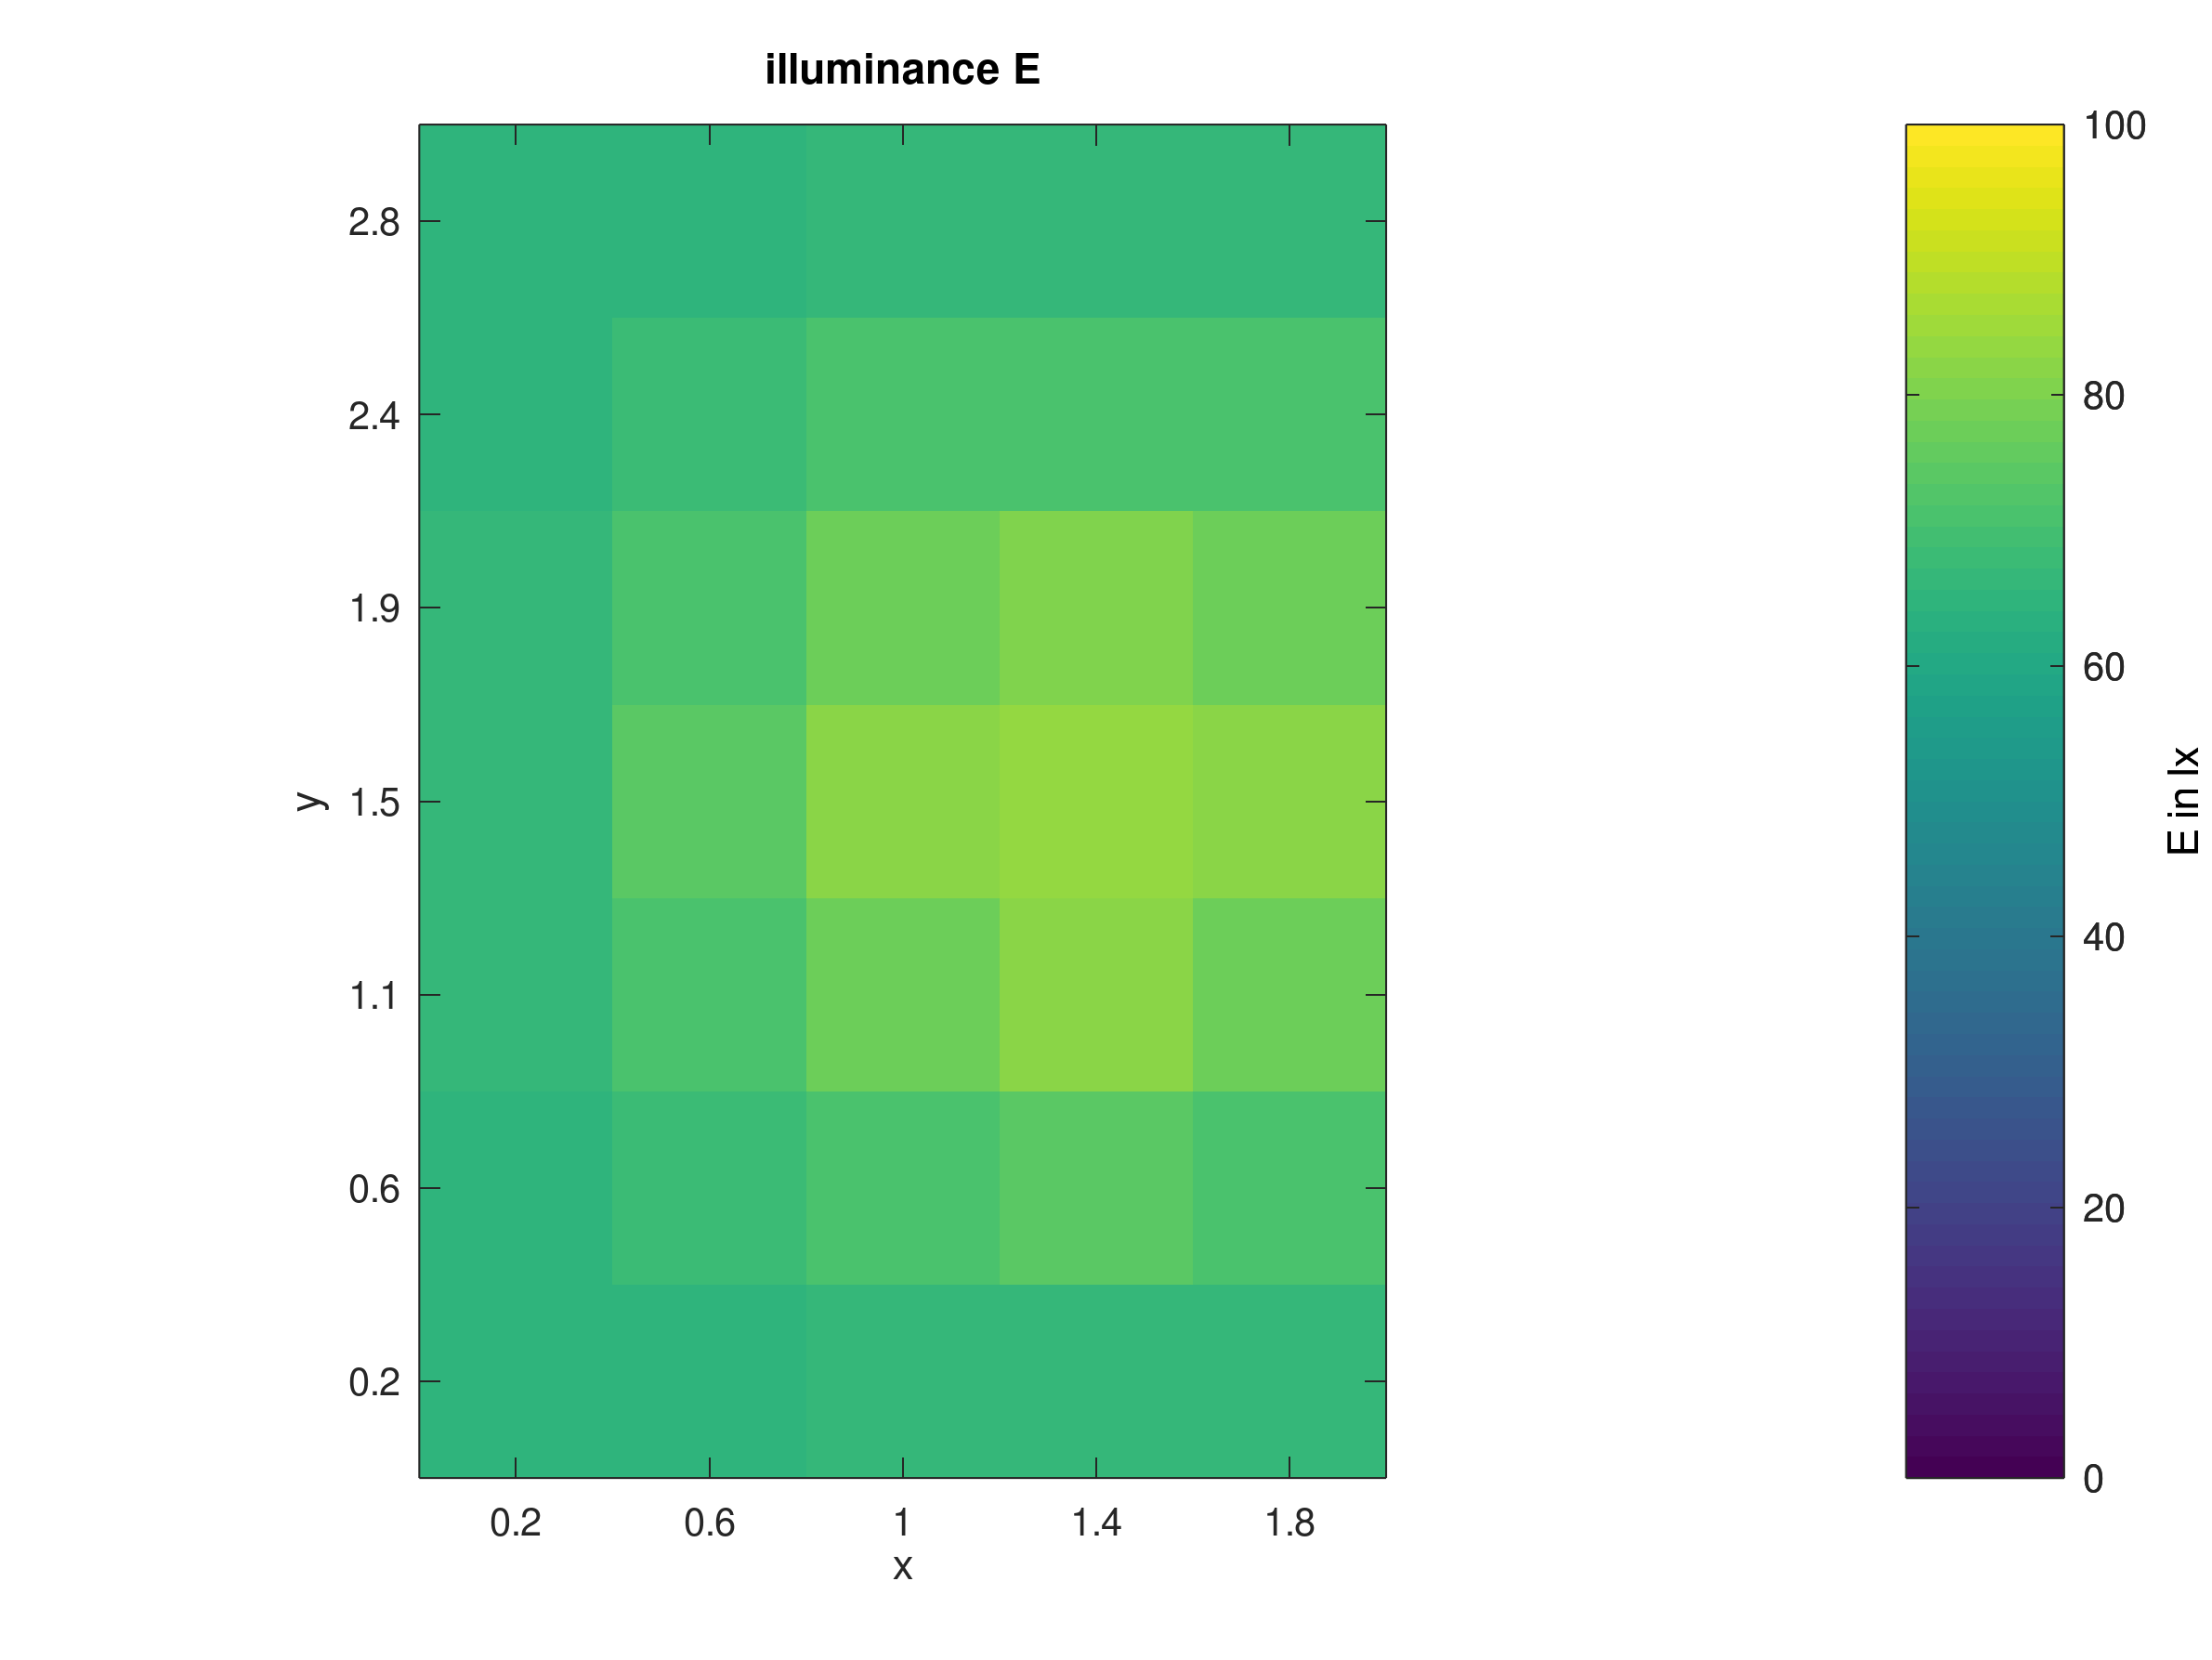
Plot illuminance measurement data for a grid determined by the egrid function using false colours and adjust colourbar limits:
[x,y] = egrid(2,3);

E = [65.0451 65.4281 66.6292 67.1130 66.7063
     65.4280 68.4963 71.0842 71.7268 71.1471
     66.6291 70.7887 77.3848 81.2140 77.3849
     67.1127 73.6917 81.5131 83.5850 81.3887
     66.6291 70.7887 77.3848 81.5566 77.4113
     65.4281 67.4780 70.9568 73.6784 70.8536
     65.0451 65.4280 66.1305 67.1127 66.1305];

plotgrid(x,y,E,'falsecolor','E in lx',[0 100])
title('illuminance E')
See also: egrid, plotisocolours
Result: