plotcfi
The plotcfi function creates a plot of the chromatic shift in a’ and b’ dimension according to the Colour Fidelity Index in CIE 224:2017 and ANSI TM30-20. Any errors in the data set or in results generated with the Lighting Toolbox are not in the liability of the CIE nor me, see licence.
See also: ciecfi, plotcfibar
Usage:
plotcfi(cfi,mode,fontsize)
Where:
| Parameter | Description |
cfi | Is a single colour fidelity index (CFI) struct, see ciecfi function. |
mode | Specifies the plot mode: ‘CIE’ plots the chromatic shift as in CIE TR 224 (default) ‘CLR’ plots the chromatic shift as in CIE TR 224 on colour background ‘TM30’ plot the chromatic shift as in ANSI TM30-20 |
fontsize | Defnies the fontsize of the text elements in ‘TM30’ plot mode, default: 16 |
Examples
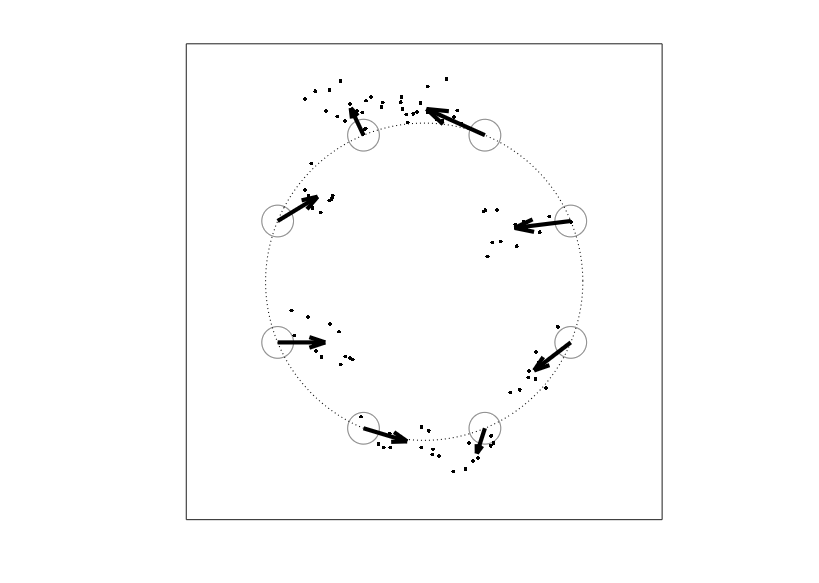
Plot the chromatic shift of standard illuminant ‘FL4’:
lam = 380:780;
spec = ciespec(lam,'FL4');
cfi = ciecfi(lam,spec);
plotcfi(cfi)
Result:
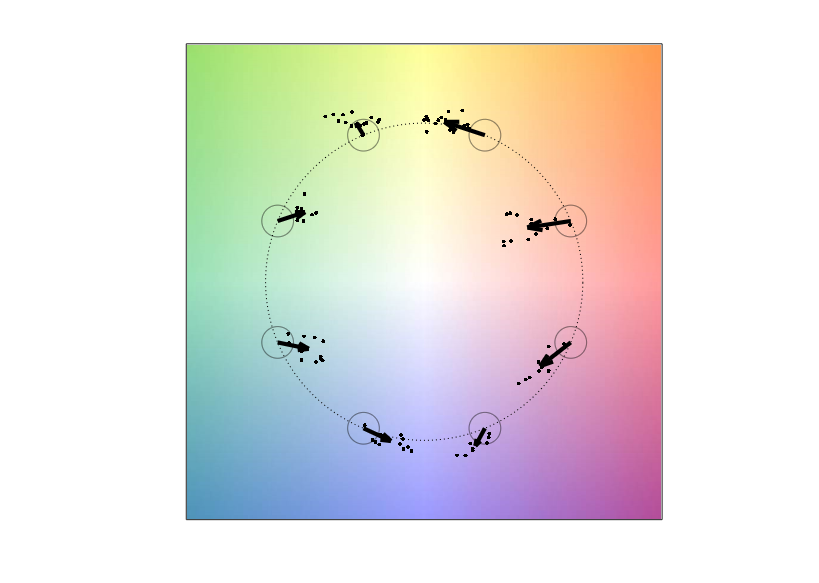
Plot the chromatic shift of standard illuminant ‘FL2’ in ‘CLR’ mode:
lam = 380:780;
spec = ciespec(lam,'FL2');
cfi = ciecfi(lam,spec);
plotcfi(cfi,'CLR')
Result:
Plot the chromatic shift of standard illuminant ‘LED-B2’ in ‘TM30’ mode:
lam = 380:780;
spec = ciespec(lam,'LED-B2');
cfi = ciecfi(lam,spec);
plotcfi(cfi,'TM30')
Result:

Reference
CIE 224:2017: CIE 2017 Colour Fidelity Index for accurate scientific use. Commission International d’Eclairage (CIE), Vienna Austria, 2017, ISBN: 978-3-902842-61-9. URL: https://cie.co.at/publications/cie-2017-colour-fidelity-index-accurate-scientific-use
ANSI/IES TM30-20: IES Method for Evaluating Light Source Color Rendition. Illuminating Engineering Society, Geneva, Switzerland, 2020, ISBN: 978-0-87995-379-9. URL: https://store.ies.org/product/tm-30-20-ies-method-for-evaluating-light-source-color-rendition/