plotaopic
The plotaopic function plots \alpha-opic images from the \alpha\Omega-meter.
Usage:
plotaopic(im,channel,mode,rot)
Where:
| Parameter | Description |
im | Is a \alpha-opic image with the channels: sc, mc, lc, rh, mel and V(\lambda). |
channel | Defines which channel to plot: ‘aopic’ for all channels (default) ‘sc’ for short cone channel ‘mc’ for medium cone channel ‘lc’ for long cone channel ‘rh’ for rhodopic/scotopic channel ‘mel’ for melanopic channel ‘VL’ for V(\lambda) channel |
mode | Plot mode: ‘log’ for logarithmic colourbar scale (default) ‘lin’ for linear colourbar scale |
rot | Sets the number of 90° image rotations, counter clockwise, scalar integer. |
Examples
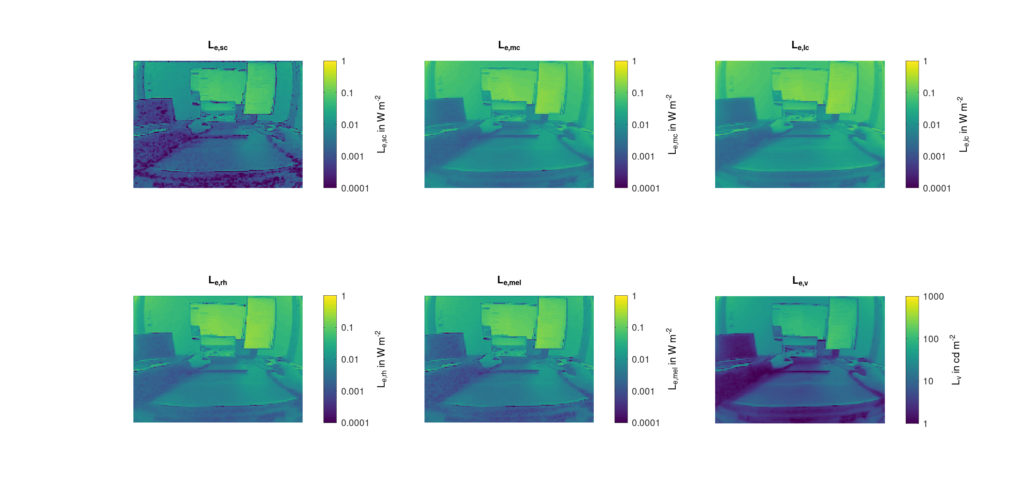
Plot \alpha-opic image from the \alpha\Omega-meter:
im = readaopic('image.aop');
plotaopic(im)
See also: readaopic
Result:
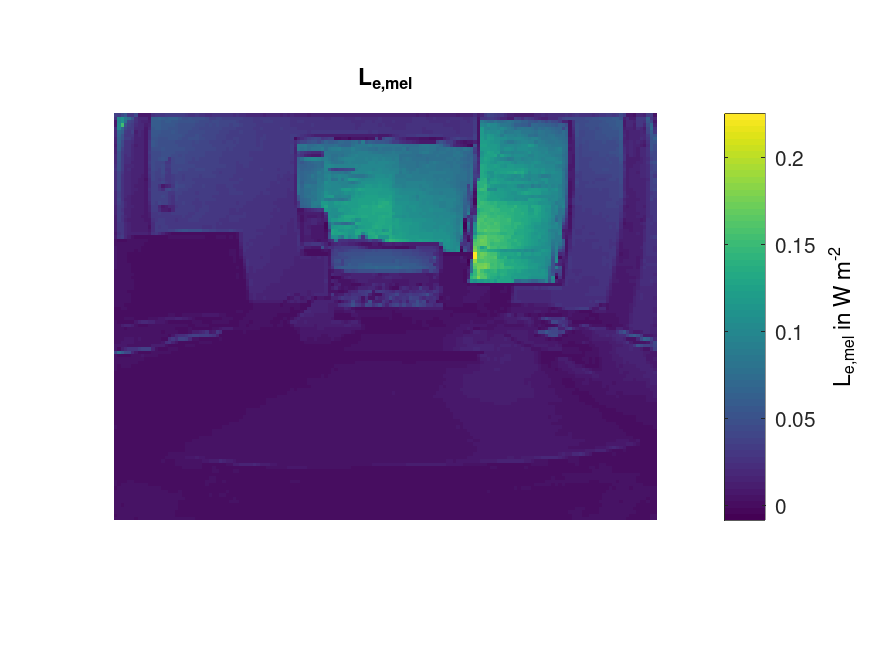
Plot melanopic channel of \alpha-opic image from the \alpha\Omega-meter in linear colour scale mode:
im = readaopic('image.aop');
plotaopic(im,'mel','lin')
See also: readaopic
Result:
Frederic Rudawski, Development of a wearable, low-cost, spatially and α-opic resolving light dosimeter, Dissertation, Technische Universität Berlin, In: DepositOnce, 2024, DOI: 10.14279/depositonce-22010.