plot2dldc
The plot2dldc function plots a 2D illustration of a given luminous intensity distribution curve (LDC).
Usage:
plot2dldc(ldt)
Where:
Example
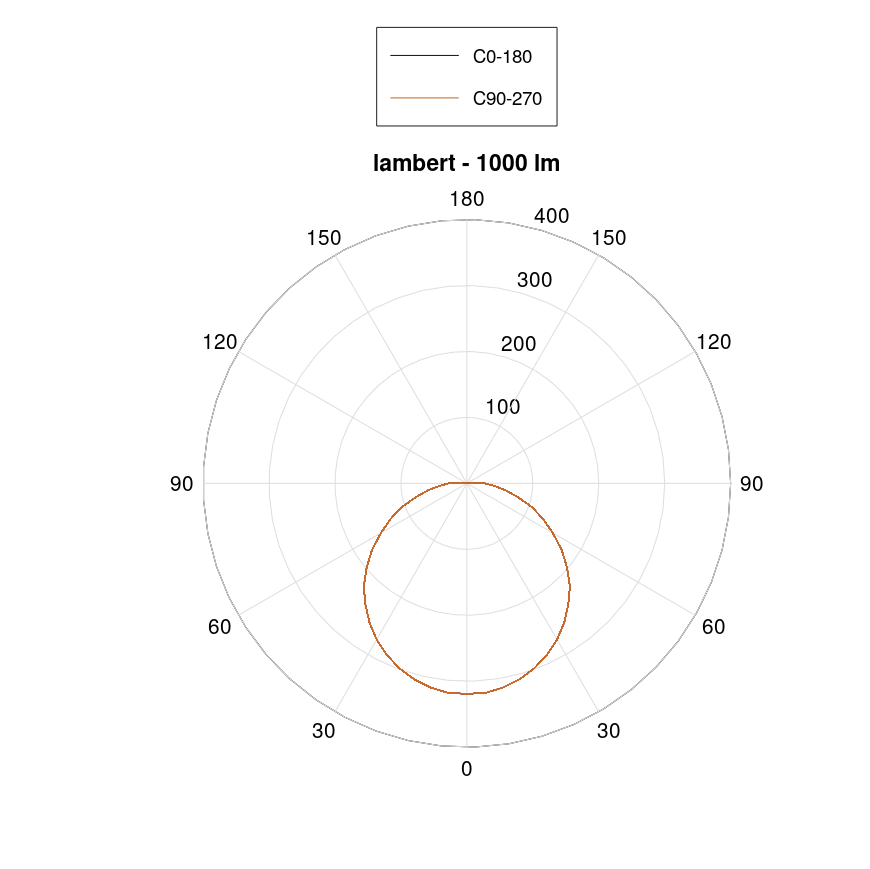
ldc = readldt('lambert.ldt');
plot2dldc(ldc)
See also: readldt
Result:
Note: To select a file via a popup dialog window, use the following code snippet:
[file,path] = uigetfile('*.ldt');
% select EULUMDAT file %
ldt = read_ldt([path file])