plotspec
The plotspec function plots a given spectrum with corresponding colours in the visible wavelength part.
Usage:
plospec(lam,spec,mode)
where:
| Parameter | Description |
lam | Specifies the wavelength steps, vector. |
spec | Defines the to be plotted spectrum, vector. |
mode | Specifies the background colour: ‘white’ (default) or ‘black’. |
Examples
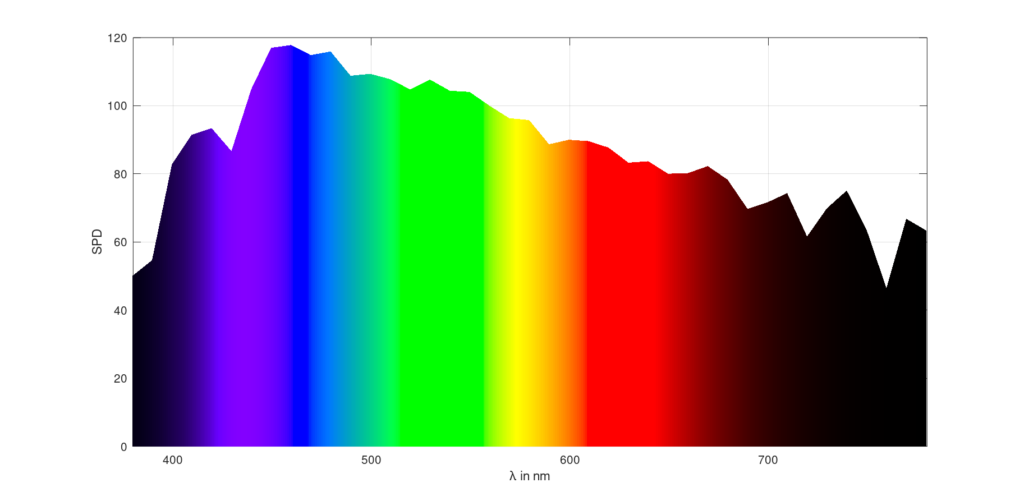
Plot standard illuminant D65 spectrum in colour:
lam = 360:830;
spec = ciespec(lam,'D65');
plotspec(lam,spec)
see also: ciespec
Result:
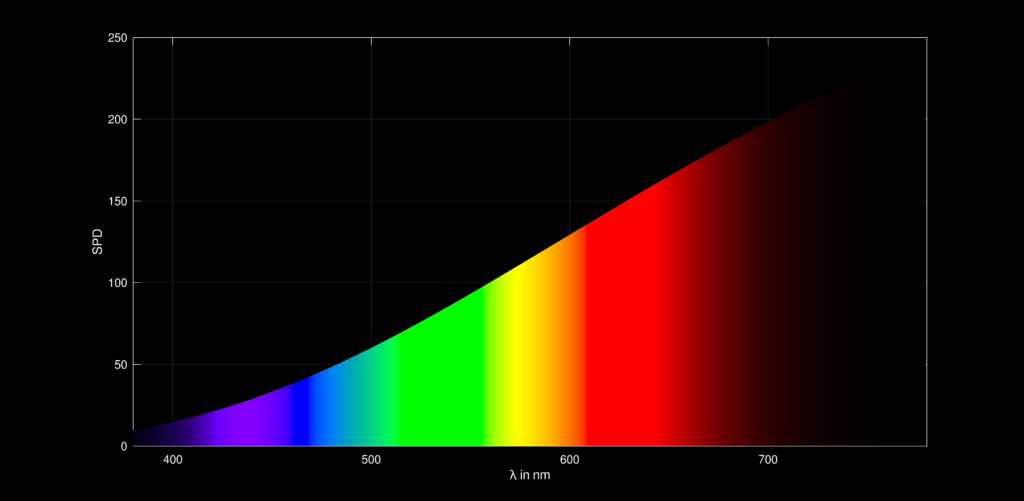
Plot standard illuminant A spectrum in colour on black background:
lam = 360:830;
spec = ciespec(lam,'A');
plotspec(lam,spec,'black')
See also: ciespec
Result:
2 Responses