
The sundiagram function creates an illustration of the sun path over the year for a specific geographic location. The default geographical settings are set in the file “LT_location.mat”. Change the settings to your preferred location and set the file to read-only in order to prevent your settings from being overwritten with the default values in future versions.
Usage:
sundiagram(coord,offset,date,time,clr)
Where:
| Parameter | Description |
coord | Specifies the geographic coordinates as 1 \times 2 vector. Default: [13.326 52.514] for Berlin, Germany. You can change the preference in the “LT_location.mat” file. |
offset(optional) | Defines the offset for local time adjustment to UTC, e.g. 2 for Central European Summer Time (CEST). Default is set to Berlin, Germany [13.326 52.514]. You can change the preference in the “LT_location.mat” file. |
date(optional) | Specifies the date in ‘DD.MM.YYYY’ format. |
time(optional) | Specifies the UTC in ‘hh:mm:ss’ or ‘hh:mm’ format. |
clr(optional) | Specifies the colour in RGB for the user defined date and time plot, default: [0.8 0.4 0.0] (orange). |
Examples
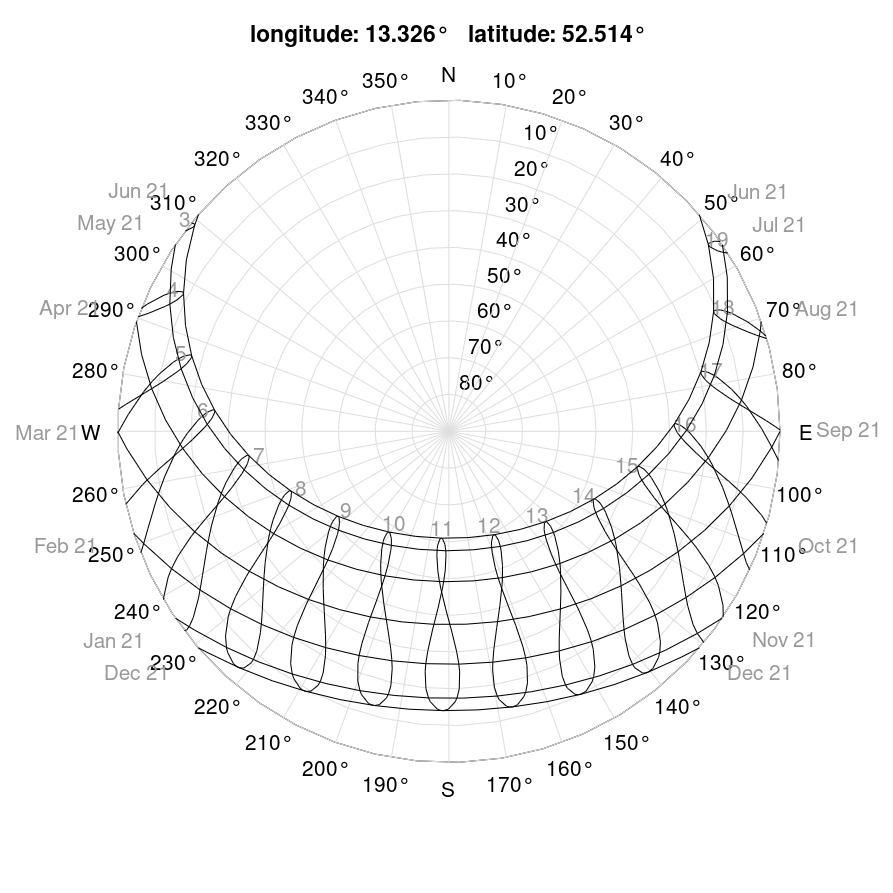
Sun path diagram for Berlin:
sundiagram
Result:
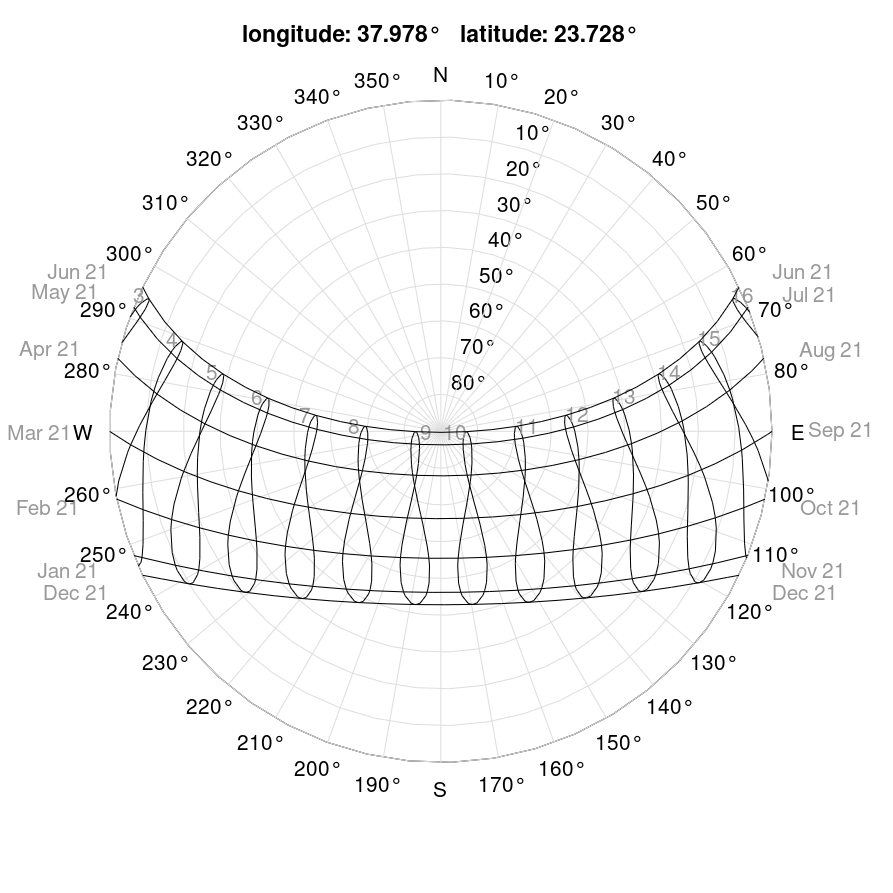
Sun path diagram for Athens:
sundiagram([37.978 23.728])
Result:
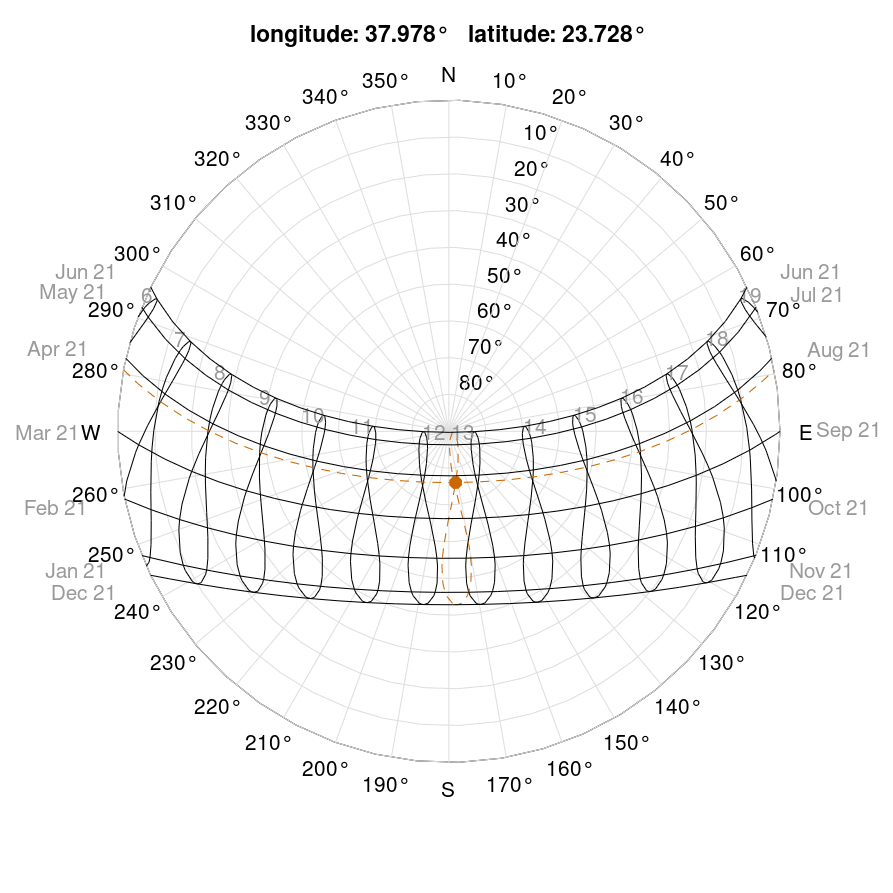
Sun path diagram for Athens with additional date and time and 3 h offset:
sundiagram([37.978 23.728],3,'15.04.2020','09:35:15')
Result:
Reference
Daylight in buildings. 2019.