specsky
The specsky function creates spectral radiance data for a Tregenza hemisphere with 145 patches for CIE sky types 3 and 12. The function utilizes the CIE method to determine a luminance distribution and a simple method by Chain et al. to derive the Correlated Colour Temperature (CCT) from the luminance distribution. The spectral radiance is determined using the CIE method given in CIE 15 Colorimetry. The Chain et al. approach was reviewed in “Forecast accuracy of existing luminance-related spectral sky models and their practical implications for the assessment of the non-image-forming effectiveness of daylight” by Diakite-Kortlever and Knoop.
See also: ciesky
Chain et al. CCT from luminance formula:
CIE sky 3
T_{cp} = 6514~\textrm{K}CIE sky 12
T_{cp} = \frac{10^6}{-132.1 + 59.77 \cdot \log_{10}(L)}~\textrm{K}Usage:
[spec,lam,L,Tcp,x,y,rgb] = specsky(type,sunaz,sunel,'parameter',value);
Where:
| Parameter | Description |
spec | Returns the spectral power distribution of a Tregenza hemisphere with 145 patches, row-wise |
lam | Specifies the wavelengths, 360:5:830 |
L | Returns the according luminance distribution of the Tregenza hemisphere |
x and y | Returns the according chromaticity coordinates x and y |
rgb | Returns a colour matrix 145 \times 3 |
type | Defines the CIE sky type: 3 or 12. |
sunaz | Is the sun azimuth angle in ° (0 – 360). The azimuth angle starts in north position and goes clockwise. |
sunel | Is the sun eleavation angle in ° (0–90). |
'target' | Specifies the target unit (optional) ’Lz’ for zenith luminance ’Eh’ for horizontal illuminance (default) |
target value | Absolute value of specified target: horizontal illuminance E_{\text{h}} or zenith luminance L_{\text{Z}}, default: Eh = 10000 |
'mode' | Enables to specifies the luminance determination mode. (optional) |
mode value | ’center’ for luminance detmerination for the patch center ’mean’ for mean luminance of the 4 patchcorner luminances as suggested by Tregenza |
Examples
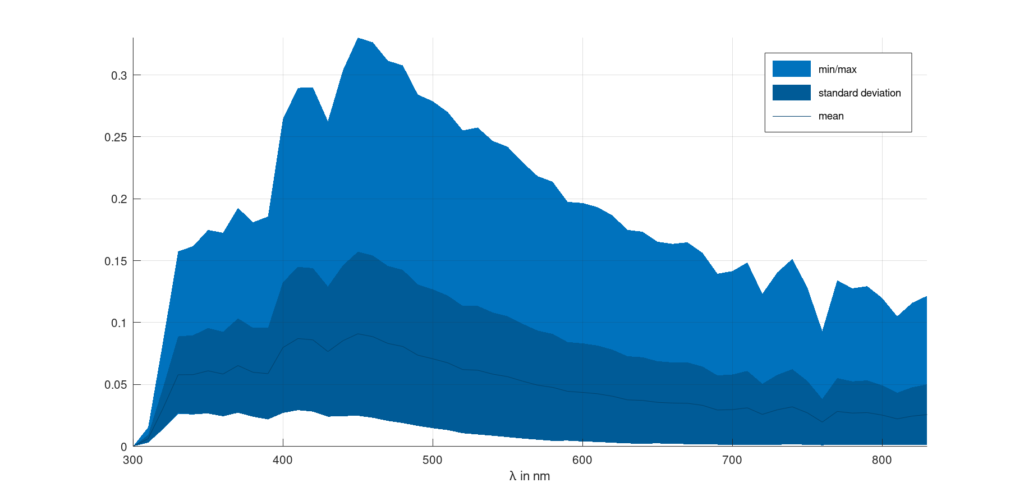
Spectral daylight distribution for CIE sky 12 at \alpha = 160° and \gamma = 30°:
[spec,lam] = specsky(12,160,30);
plotspecrange(lam,spec);
See also: plotspecrange
Result:

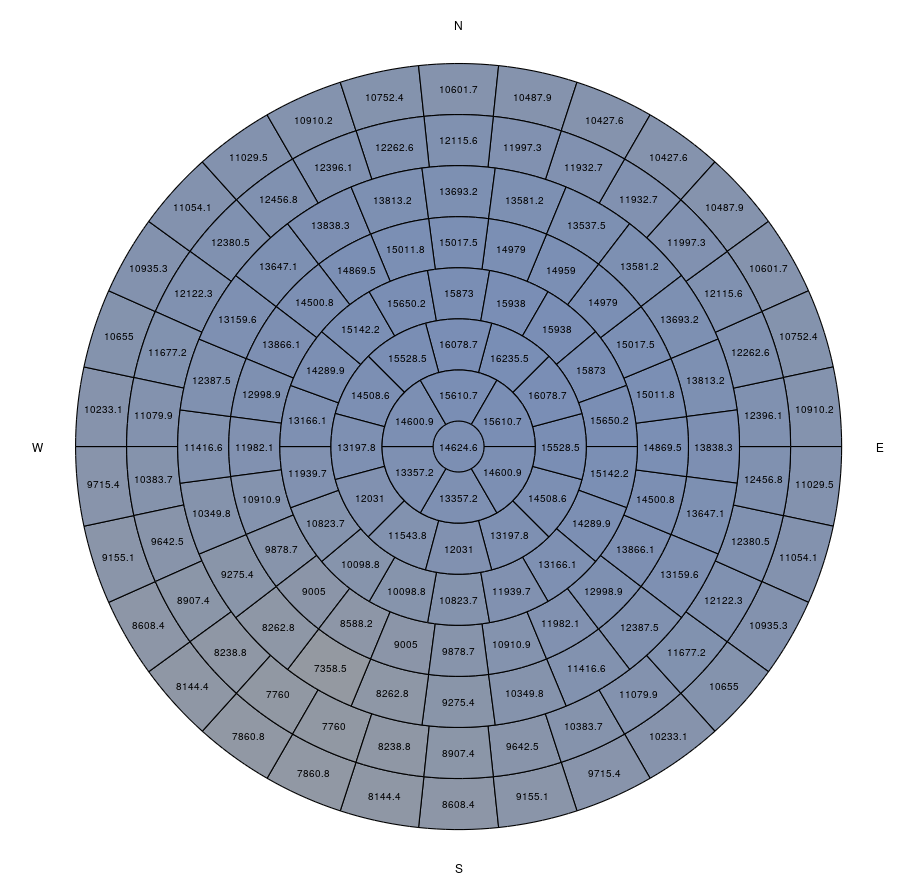
Spectral daylight distribution for CIE sky 12 at \alpha = 210° and \gamma = 20° for E_h = 15000~\textrm{lx} with additional data:
[spec,lam,L,Tcp,x,y,rgb] = specsky(12,210,30,'Eh',15000);
plottregenza(Tcp,rgb)
See also: plottregenza
Result:

References
Chain C, Dumortier D, Fontoynont M. A comprehensive model of luminance, correlated colour temperature and spectral distribution of skylight: comparison with experimental data. Solar Energy 1999; 65: 285–295.
ISO 15469:2004(E)/CIE S 011/E:2003: Spatial Distribution of Daylight – CIE Standard General Sky. Commission internationale de l’Éclairage (CIE), Vienna Austria, 2004. URL: https://cie.co.at/publications/spatial-distribution-daylight-cie-standard-general-sky
Peter Roy Tregenza: Subdivision of the sky hemisphere for luminance measurements. In: Lighting Research and Technology, vol. 19, no. 1, pp. 13-14, 1987, DOI: 10.1177/096032718701900103. URL: https://journals.sagepub.com/doi/10.1177/096032718701900103
CIE 15:2018: Colorimetry, 4th Edition. Commission Internationale de l’Eclairage (CIE), Vienna Austria, 2018, ISBN: 978-3-902842-13-8 , DOI: 10.25039/TR.015.2018. URL: https://cie.co.at/publications/colorimetry-4th-edition