plotspecrange
The plotspecrange function creates a statistical evaluation of an arbitrary number of spectra and plots the mean values, standard deviation (SD) and the minima and maxima values.
Usage:
x = plotspecrange(lam,spec,'parameter','value')
Where:
| Parameter | Description |
x | Is a return struct containing the mean values, stadard deviation and minima and maxima values. |
lam | Specifies the spectra wavelengths, vector. |
spec | Is the input spectra vector or matrix. |
'color' | Defines the plot base color, 1\times 3 vector. default: [0 0.6 0.9] |
'legend' | Sets the legend mode: ‘on’ default ‘off’ |
Examples
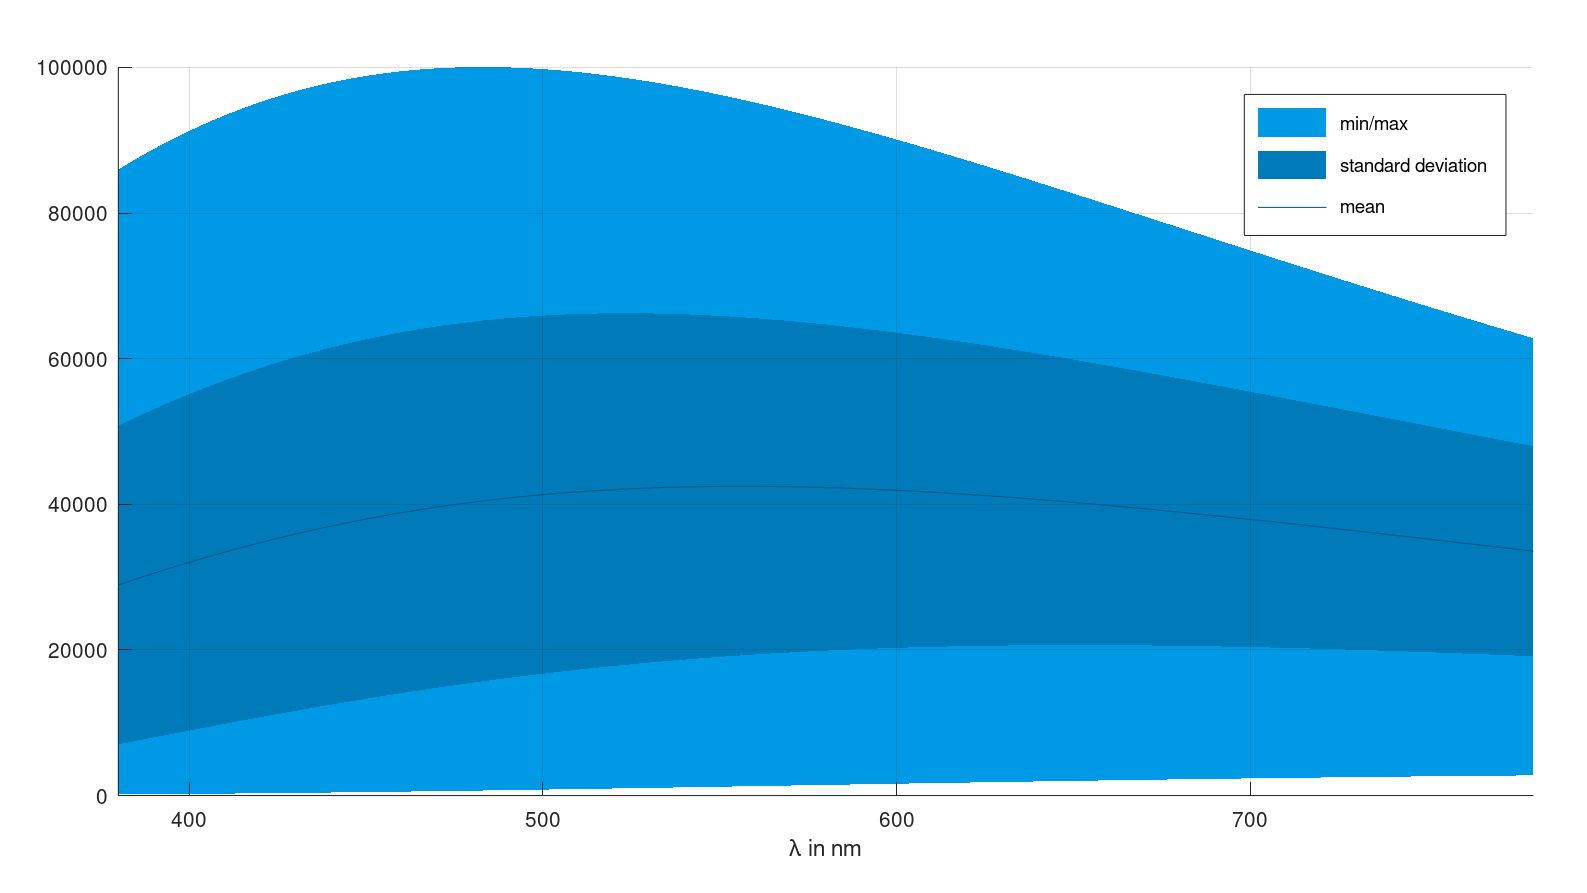
Plot diverse black body planck spectra:
lam = 380:780;
T = [3000 4500:100:5500 6000];
spec = planck(T,lam);
plotspecrange(lam,spec);
See also: planck
Result:
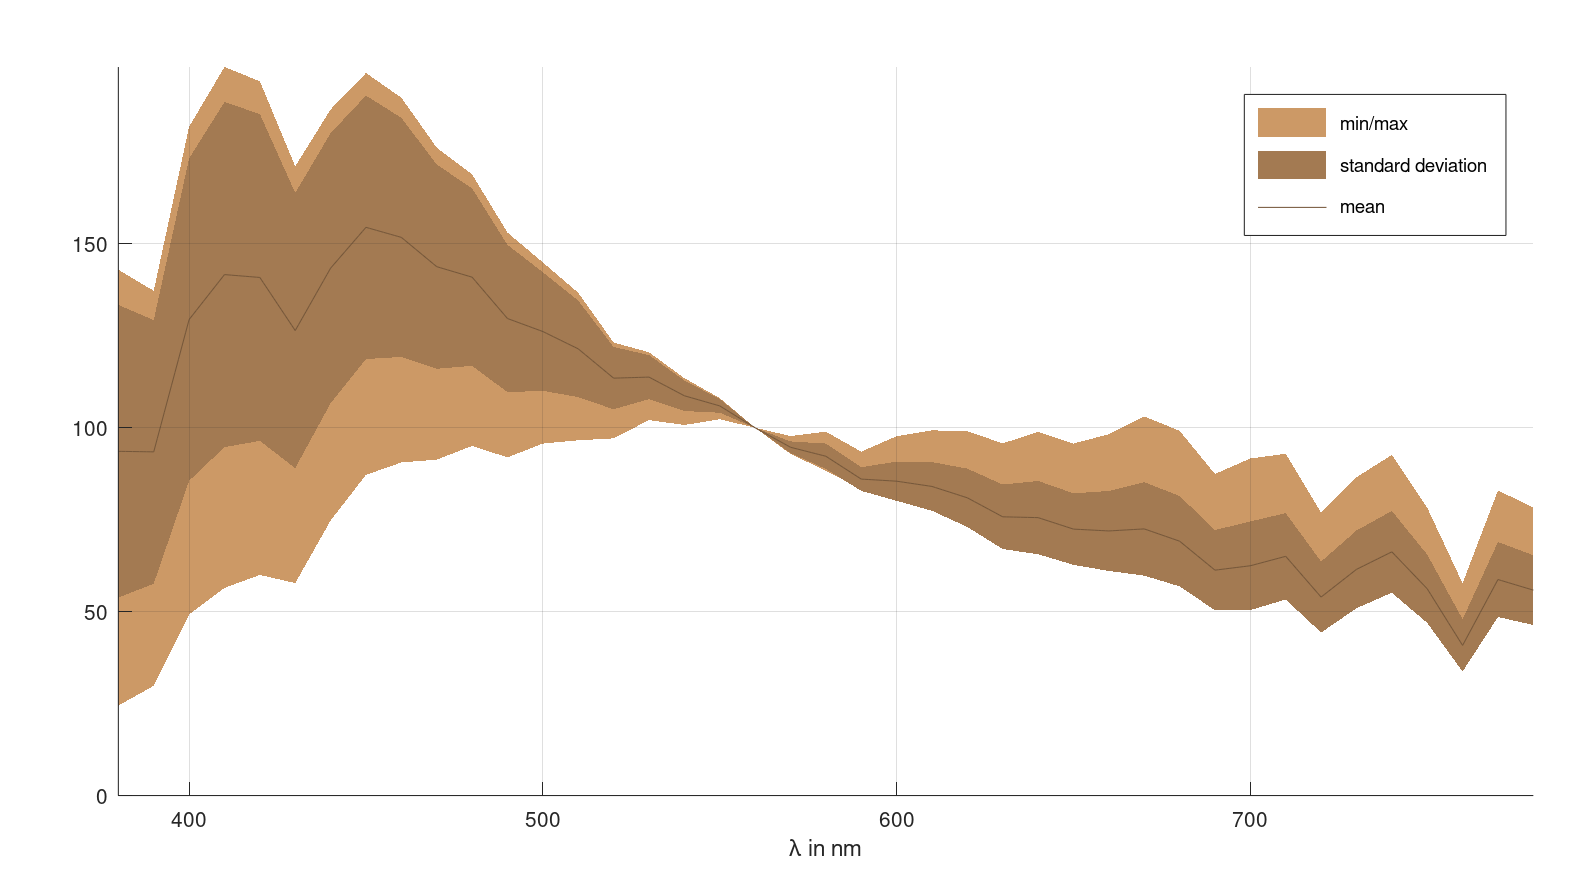
Plot diverse daylight spectra in a specified colour:
lam = 380:780;
T = [5000:1000:15000];
spec = ciecct2spec(T,lam);
plotspecrange(lam,spec,'color',[0.8 0.6 0.4]);
See also: ciecct2spec
Result: