The plotcolour function plots a series of colours defined in an n\times 3 matrix.
Note: The function also works with the alternative spelling: plotcolor
Usage:
plotcolour(c)
Where:
| Parameter | Description |
c | Is a n\times 3 colour matrix. |
Examples
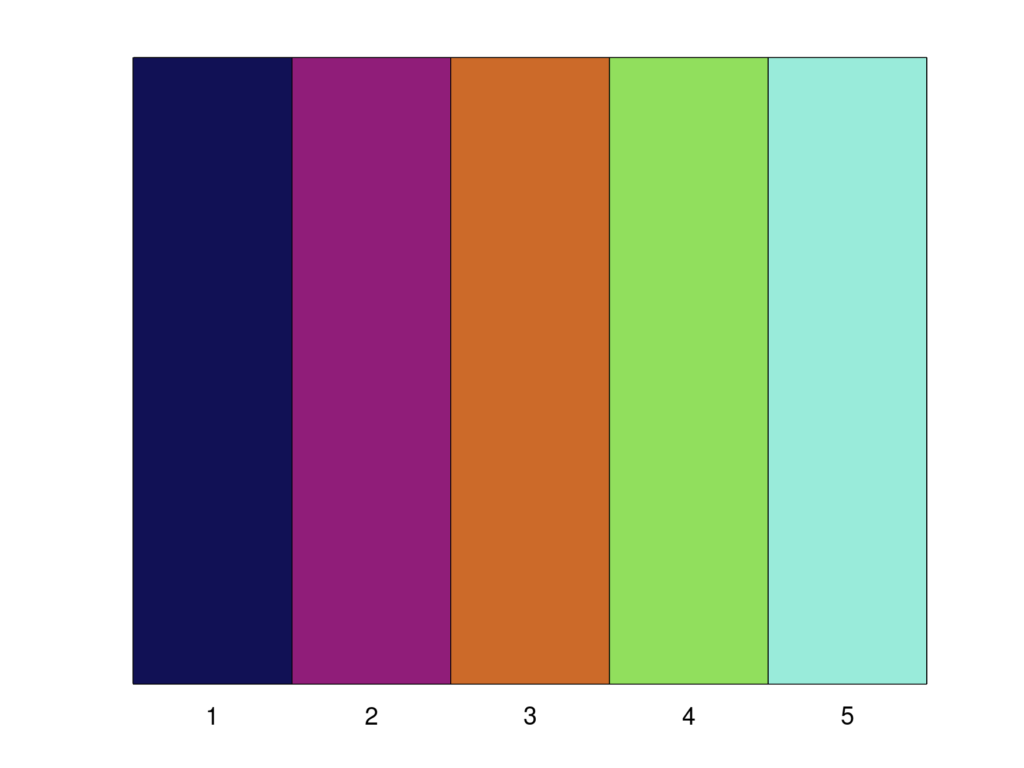
Plot 5 different colours:
c = colours(5);
plotcolour(c)
See also: colours
Result:
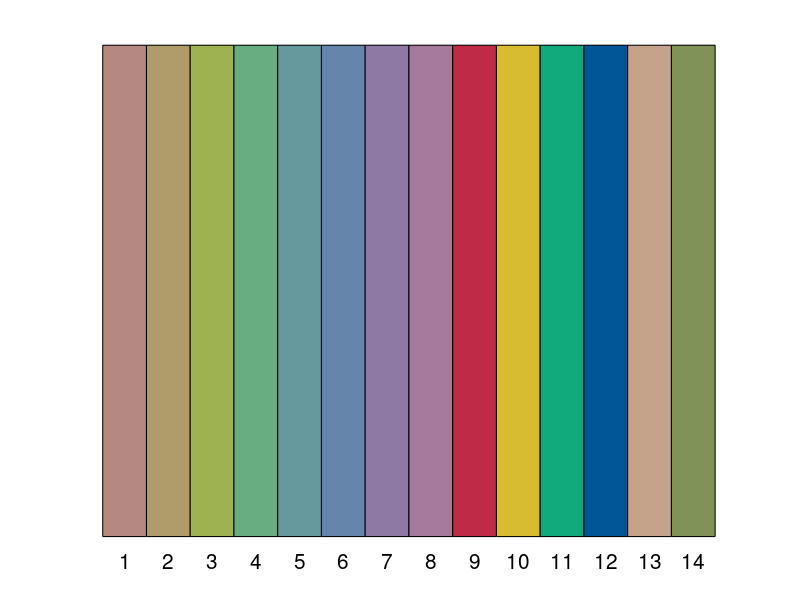
Plot CIE Colour Rendering Index (CRI) reference colours:
lam = 380:780;
CRI = ciespec(lam,'CRI');
D65 = ciespec(lam,'D65');
spec = CRI.*D65;
c = spec2srgb(lam,spec);
plotcolour(c)
See also: spec2srgb
Result: